
Mathematics, 16.11.2020 19:30 mabutler2013
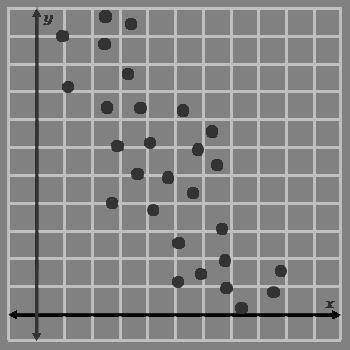
On a graph, points are grouped together and decrease.
Identify the level of association and correlation in the scatterplot.
A. strong association, negative correlation
B. weak association, negative correlation
C. strong association, positive correlation
D. weak association, positive correlation

Answers: 2


Other questions on the subject: Mathematics
Mathematics, 21.06.2019 17:00, samantha9430
The magnitude, m, of an earthquake is defined to be m=log l/s, where i is the intensity of the earthquake (measured by the amplitude of the seismograph wave) and s is the intensity of a “standard” earthquake, which is barely detectable. what is the magnitude of an earthquake that is 1,000 times more intense than a standard earthquake? use a calculator. round your answer to the nearest tenth.
Answers: 1
Mathematics, 21.06.2019 22:30, scholarlystudenttt28
Which one is the correct answer, and why?
Answers: 1
You know the right answer?
On a graph, points are grouped together and decrease.
Identify the level of association and correla...
Questions in other subjects:
Mathematics, 28.04.2021 18:40


Mathematics, 28.04.2021 18:40


Mathematics, 28.04.2021 18:40
Mathematics, 28.04.2021 18:40

Arts, 28.04.2021 18:40


