
Mathematics, 16.11.2020 19:30 twentyonepilots12018
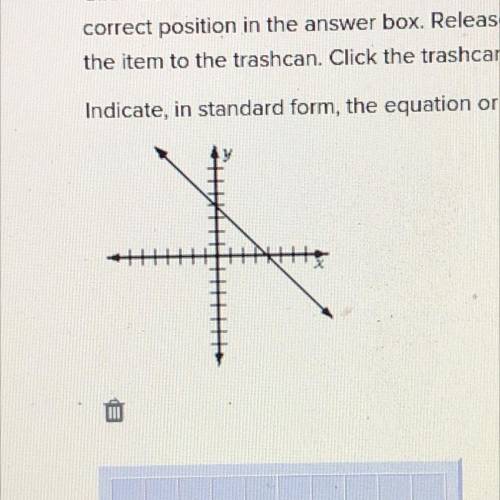
Click an item in the list or group of pictures at the bottom of the problem and, holding the button down, drag it into the
correct position in the answer box. Release your mouse button when the item is place. If you change your mind, drag
the item to the trashcan. Click the trashcan to clear all your answers.
Indicate, in standard form, the equation or inequality that is shown by the graph.

Answers: 2


Other questions on the subject: Mathematics
Mathematics, 22.06.2019 00:30, winterblanco
Answer 20 points and brainiest ! on the board, your teacher writes an example of how to find the median. one of the numbers is erased, leaving what is shown, 18, 30, 26,12 22. what is the median? a. 10 b. 20 c. 24 d. 28
Answers: 1
Mathematics, 22.06.2019 01:10, ceeciliaaa13
|y + 2| > 6 {y|y < -8 or y > 4} {y|y < -6 or y > 6} {y|y < -4 or y > 4}
Answers: 2
Mathematics, 22.06.2019 02:30, nawafcanada
The graph shows the amount of total rainfall at each hour what was the total rainfall amount after three hours
Answers: 1
Mathematics, 22.06.2019 03:30, emilylunaa
Sections of prefabricated woods are each 5 1/3 feet long, how long are 7 1/2 sections placed end to end?
Answers: 3
You know the right answer?
Click an item in the list or group of pictures at the bottom of the problem and, holding the button...
Questions in other subjects:
Mathematics, 09.09.2020 22:01


