
Mathematics, 16.11.2020 04:40 lyss12326
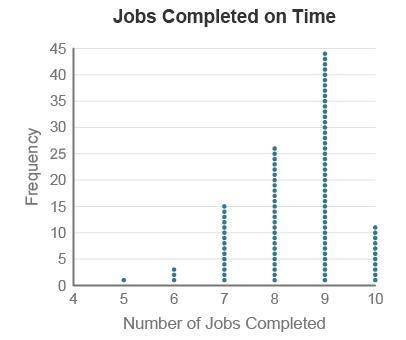
A contractor claims that she finishes a job on time 90% of the time. Last month, she only completed 7 out of her 10 jobs on time. To see if this is surprisingly low, a simulation was conducted 100 times under the assumption that she really does complete 90% of her jobs on time.
The dotplot contains 100 trials of this simulation.
A dotplot titled jobs completed on time has number of jobs completed on the x-axis, and frequency on the y-axis. 5, 1; 6, 3; 7, 15; 8, 26; 9, 45; 10, 11.
Based on this dotplot and the sample of last month’s on-time completions, which conclusion can be drawn?
The contractor’s true, on-time completion rate is only 50%.
It is most likely that the contractor will complete about 9 out of 10 jobs.
If we used a larger sample size of 40 jobs, the simulated dotplot would be different; therefore, we cannot draw a conclusion.
The dotplot does not provide convincing evidence that her true, on-time completion rate is less than 90% because 7 or fewer on-time completions happened 19% of the time in the simulation.

Answers: 1


Other questions on the subject: Mathematics
Mathematics, 21.06.2019 22:00, pandyjunk3981
Let event a = you roll an even number on the first cube. let event b = you roll a 6 on the second cube. are the events independent or dependent? why?
Answers: 1
Mathematics, 22.06.2019 00:00, blachaze8729
Darragh has a golden eagle coin in his collection with a mass of 13.551\,\text{g}13.551g. an uncirculated golden eagle coin has a mass of 13.714\,\text{g}13.714g.
Answers: 2
You know the right answer?
A contractor claims that she finishes a job on time 90% of the time. Last month, she only completed...
Questions in other subjects:

Mathematics, 09.04.2020 02:56


Biology, 09.04.2020 02:56

English, 09.04.2020 02:57

Advanced Placement (AP), 09.04.2020 02:57


