Mathematics, 15.11.2020 19:50 22iungj
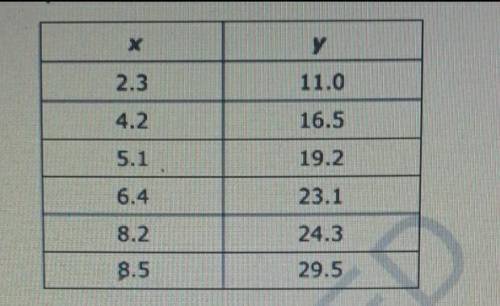
A statistician collected the following data to explore the relationship between two variables, x and y. The statistician performed a linear regression and also plotted the residuals, Based on the residual plot, the statistician decided to exclude one data point. The statistician then performed linear regression on the set of remaining data points. The result was that the new linear model fit the remaining data more closely than the original model fit the original data.
Which data point did the statistician exclude?
A (2.3, 11.0)
В (4.2, 16.5)
С (6.4, 23.1)
D (8.2, 24.3)


Answers: 2


Other questions on the subject: Mathematics

Mathematics, 21.06.2019 13:10, cristian901997
What is the greatest common factor of 8 and 36
Answers: 2


Mathematics, 21.06.2019 22:00, taliyahjhonson1
The birth weights of newborn babies in the unites states follow in a normal distrubution with a mean of 3.4 kg and standard deviation of 0.6 kg. reaserches interested in studying how. children gain weights decide to take random samples of 100 newborn babies and calculate the sample mean birth weights for each sample
Answers: 1

Mathematics, 21.06.2019 22:30, gilcarrillo146
Micheal is 4 times as old as brandon and is also 27 years older than brandon. how old is micheal
Answers: 2
You know the right answer?
A statistician collected the following data to explore the relationship between two variables, x and...
Questions in other subjects:

Mathematics, 26.03.2021 04:50


Mathematics, 26.03.2021 04:50

Mathematics, 26.03.2021 04:50


Social Studies, 26.03.2021 04:50

Mathematics, 26.03.2021 04:50


