
Mathematics, 14.11.2020 21:30 hannahgrace325
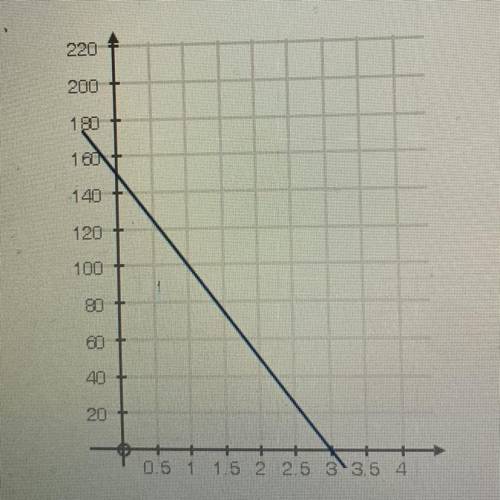
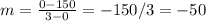
The graph below plots a function f(x):
If x represents time, the average rate of change of the function f(x) in the first three
seconds is.

Answers: 1


Other questions on the subject: Mathematics
Mathematics, 21.06.2019 22:00, nancysue1975
How many ordered pairs of positive integers satisfy xy=32?
Answers: 1
Mathematics, 21.06.2019 22:00, deannajd03
Which two transformations are applied to pentagon abcde to create a'b'c'd'e'? (4 points) translated according to the rule (x, y) ? (x + 8, y + 2) and reflected across the x-axis translated according to the rule (x, y) ? (x + 2, y + 8) and reflected across the y-axis translated according to the rule (x, y) ? (x + 8, y + 2) and reflected across the y-axis translated according to the rule (x, y) ? (x + 2, y + 8) and reflected across the x-axis
Answers: 1
Mathematics, 22.06.2019 00:30, coolman12062
3c2 + 2d)(–5c2 + d) select all of the partial products for the multiplication problem above.
Answers: 2
You know the right answer?
The graph below plots a function f(x):
If x represents time, the average rate of change of the func...
Questions in other subjects:


