
Mathematics, 14.11.2020 01:00 tckryoung
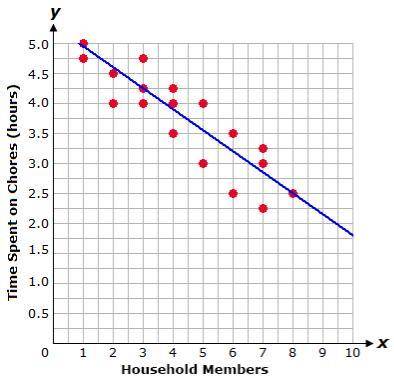
The graph shows a relationship between the size of 18 households and the average amount of time, in hours, each member of the household spends on chores per week. Which equation best models this data set?
A. y = 0.34x + 5.19
B. y = -0.34x - 5.19
C. y = 0.34x - 5.19
D. y = -0.34x + 5.19

Answers: 3
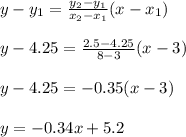
 , Since rise of the line is negative and run is positive, slope will be negative]
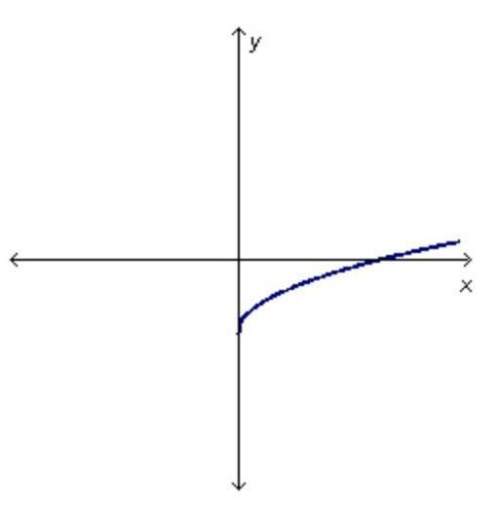


Other questions on the subject: Mathematics
Mathematics, 21.06.2019 22:00, angeline2004
Given the quadratic function f(x)=3x^2-24x+49 a. use “completing the squares” to convert the quadratic function into vertex form b. state the vertex c. find the x and y intercepts d. graph the function
Answers: 1
Mathematics, 21.06.2019 23:50, BreBreDoeCCx
You so much whoever answers with accuracy •the parent function of the graph of f(x) is the square root function, which was reflected across the x-axis. which of the following is the equation of f(x)?
Answers: 1
You know the right answer?
The graph shows a relationship between the size of 18 households and the average amount of time, in...
Questions in other subjects:

Mathematics, 18.03.2021 15:20
Mathematics, 18.03.2021 15:20
Mathematics, 18.03.2021 15:20
Mathematics, 18.03.2021 15:20
Engineering, 18.03.2021 15:20

Geography, 18.03.2021 15:20

Biology, 18.03.2021 15:20
Mathematics, 18.03.2021 15:20


