
Mathematics, 13.11.2020 20:20 emilaw7823
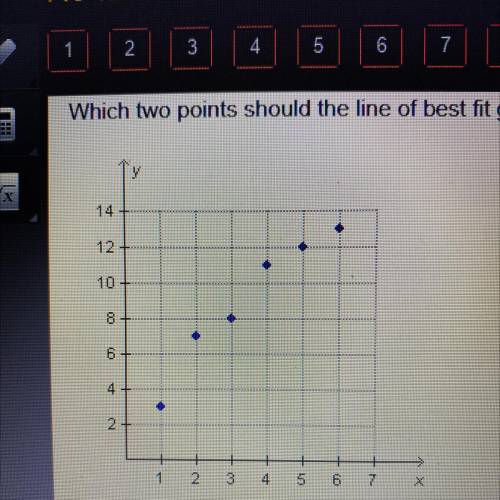
Which two points should the line of best fit go through to best represent the data in the scatter plot?
A. (1,3) and (2,7)
B. (1,3) and (6,13)
C. (3,8) and (5,12)
D. (5,12) and (6,13)

Answers: 3


Other questions on the subject: Mathematics
Mathematics, 21.06.2019 19:30, bigboss2984
Hey am have account in but wished to create an account here you guys will me with my make new friends of uk !
Answers: 1
Mathematics, 21.06.2019 20:30, alexialiles19
Max recorded the heights of 500 male humans. he found that the heights were normally distributed around a mean of 177 centimeters. which statements about max’s data must be true? a) the median of max’s data is 250 b) more than half of the data points max recorded were 177 centimeters. c) a data point chosen at random is as likely to be above the mean as it is to be below the mean. d) every height within three standard deviations of the mean is equally likely to be chosen if a data point is selected at random.
Answers: 2
Mathematics, 21.06.2019 22:30, vsuescun10
For the chance to be team captain, the numbers 1-30 are put in a hat and you get two chances to pick a number, without replacement. which formula correctly shows how to find the probability that you choose the number 1 and then 2?
Answers: 1
Mathematics, 22.06.2019 01:00, aatharris21
Azul has 4 green picks and no orange picks. you add orange picks so that there are 2 orange picks for every 1 green pick. how many picks are there now.
Answers: 1
You know the right answer?
Which two points should the line of best fit go through to best represent the data in the scatter pl...
Questions in other subjects:

Mathematics, 05.02.2021 08:20


Mathematics, 05.02.2021 08:20


