
Mathematics, 13.11.2020 18:50 sophia4636
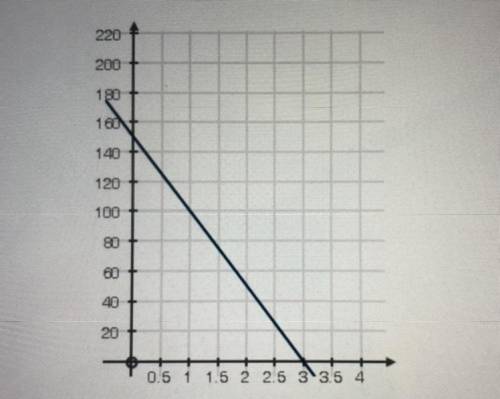
The graph plots a function f(x): If x represents time, the average rate of change of the the function f(x) in the first three seconds is___.

Answers: 1


Other questions on the subject: Mathematics
Mathematics, 21.06.2019 18:30, lealiastentz532542
The base of a triangle exceeds the height by 9 inches. if the area is 180 square inches, find the length of the base and the height of the triangle.
Answers: 1
Mathematics, 21.06.2019 20:30, cogger9348
3.17 scores on stats final. below are final exam scores of 20 introductory statistics students. 1 2 3 4 5 6 7 8 9 10 11 12 13 14 15 16 17 18 19 20 57, 66, 69, 71, 72, 73, 74, 77, 78, 78, 79, 79, 81, 81, 82, 83, 83, 88, 89, 94 (a) the mean score is 77.7 points. with a standard deviation of 8.44 points. use this information to determine if the scores approximately follow the 68-95-99.7% rule. (b) do these data appear to follow a normal distribution? explain your reasoning using the graphs provided below.
Answers: 1
You know the right answer?
The graph plots a function f(x):
If x represents time, the average rate of change of the the functi...
Questions in other subjects:
Mathematics, 06.07.2021 15:30
Mathematics, 06.07.2021 15:30


English, 06.07.2021 15:30
Mathematics, 06.07.2021 15:30

Biology, 06.07.2021 15:30

Physics, 06.07.2021 15:30
English, 06.07.2021 15:30


