
The following line graph shows the attendance at an annual event from 1998

Mathematics, 13.11.2020 01:30 stevenabdullatif16
Se Home
ework
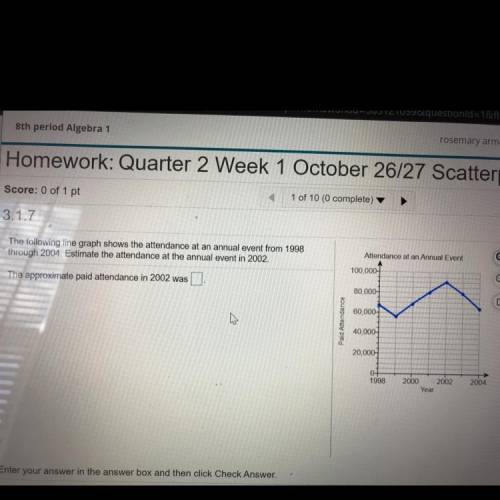
The following line graph shows the attendance at an annual event from 1998
through 2004. Estimate the attendance at the annual event in 2002,
The approximate paid attendance in 2002 was.
Attendance at an Annual Event
100,000
zes & Tests
Q
80,000
dy Plan
60.000
Paid Attendance
debook
40,000
20.000
apter Contents
0-
1998
ols for Success
2000
2002
Year
2004
ultimedia Librai
earson Tutor
ervices

Answers: 1


Other questions on the subject: Mathematics
Mathematics, 21.06.2019 14:30, snoodledoodlebop
anyone? find the second, fifth, and ninth terms of a sequence where the first term is 65 and the common difference is -7. 72, 93, 121 72, 79, 86 58, 37, 9 58, 51, 44
Answers: 1
Mathematics, 21.06.2019 16:30, macenzie26
What could explain what happened when the time was equal to 120 minutes
Answers: 2
Mathematics, 21.06.2019 18:00, brooke0713
Galen sold tickets of his church’s carnival for a total of $2,820. children’s tickets cost $3 each and adult tickets cost $5 each. the number of children’s tickets sold was 30 more than 3 times the number of adult tickets slod. how many children’s ticket and how many adult tickets did he sell?
Answers: 2
Mathematics, 21.06.2019 19:30, leilanimontes714
Solve the following simultaneous equation by using an algebraic method (either substitution or elimination) 2x + 3y=-4 4x-y=11
Answers: 1
You know the right answer?
Se Home
ework
The following line graph shows the attendance at an annual event from 1998
The following line graph shows the attendance at an annual event from 1998
Questions in other subjects:


English, 08.12.2020 06:20
Mathematics, 08.12.2020 06:20
English, 08.12.2020 06:20

Biology, 08.12.2020 06:20


