POSSIBLE POINTS: 16.67
Figure MNOP is similar to figure SRUT.
N
R
9 cm
6 cm...

Mathematics, 12.11.2020 22:30 Xavier2712
POSSIBLE POINTS: 16.67
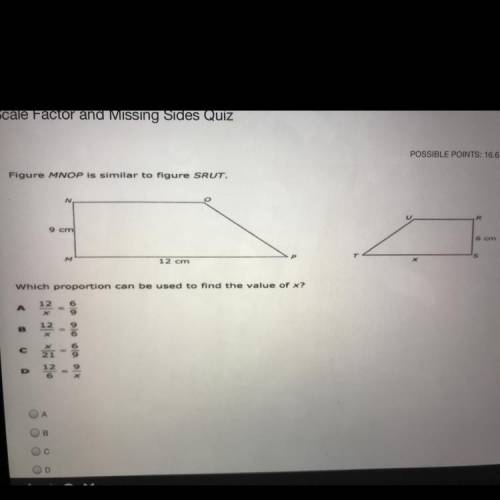
Figure MNOP is similar to figure SRUT.
N
R
9 cm
6 cm
M
12 cm
Which proportion can be used to find the value of x?
12
A
OM * * * * 5
*100 000
с
0
OA

Answers: 1


Other questions on the subject: Mathematics
Mathematics, 21.06.2019 22:50, sarbjit879
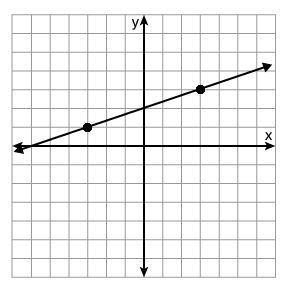
Which linear inequality is represented by the graph?
Answers: 1
Mathematics, 22.06.2019 04:00, warrior4516
What is the answer to this problem? ignore the work. what is the correct answer?
Answers: 1
Mathematics, 22.06.2019 04:00, kalawson2019
The graph below represents which system of inequalities? a. y< -2x+6 y< (or equal to) x+2 b. y< (or equal to) -2x+6 y c. y< 2/3 x - 2 y> (or equal to) 2x +2 d. none of the above
Answers: 2
You know the right answer?
Questions in other subjects:


Chemistry, 20.11.2020 21:50
English, 20.11.2020 21:50


History, 20.11.2020 21:50
Mathematics, 20.11.2020 21:50


