Help me
Line ℓ is perpendicular to line m. Find the value of x and w.
...

Mathematics, 12.11.2020 06:20 latezwardjr15
Help me
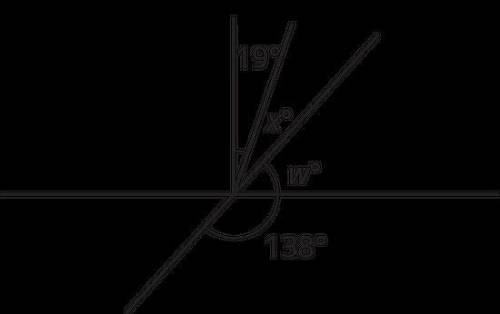
Line ℓ is perpendicular to line m. Find the value of x and w.

Answers: 3


Other questions on the subject: Mathematics
Mathematics, 21.06.2019 22:00, mileto1798
Write a description of each inequality. 1. -5a + 3 > 1 2. 27 - 2b < -6 (this < has a _ under it) 3. 1/2 (c + 1) > 5 (this > has a _ under it)
Answers: 3
Mathematics, 22.06.2019 00:30, tsimm3618
Will mark brainliest for correct answer! i have been on this problem for an hour and can't find the answer. i'm begging here! incase you cant read the instructions in the picture because of too much or too little lighting: note: enter your answer and show all the steps that you use to solve this problem in the space provided. write a list of steps that are needed to find the measure of b. provide all steps as clear as possible, !
Answers: 1
Mathematics, 22.06.2019 00:30, swaggsuperman713
(i really need ) read the story problem, and then answer the questions that follow. gordon works for a graphic design firm and is creating a label for a food truck vendor. the vendor specializes in finger food and wants to sell food in right conical containers so that they are easy for people to hold. to complete his label, gordon needs to collect several different measurements to ensure that the label he designs will fit the surface of the container. gordon has been told that the containers have a diameter of 4 inches and a height of 6 inches. part a: find the slant height of the cone. the slant height is the distance from the apex, or tip, to the base along the cone’s lateral surface. show your work. part b: find the measure of the angle formed between the base of the cone and a line segment that represents the slant height. part c: imagine two line segments where each represents a slant height of the cone. the segments are on opposite sides of the cone and meet at the apex. find the measurement of the angle formed between the line segments.
Answers: 1
Mathematics, 22.06.2019 01:30, karsenbeau
Given are five observations for two variables, x and y. xi 1 2 3 4 5 yi 3 7 5 11 14 which of the following is a scatter diagrams accurately represents the data? what does the scatter diagram developed in part (a) indicate about the relationship between the two variables? try to approximate the relationship betwen x and y by drawing a straight line through the data. which of the following is a scatter diagrams accurately represents the data? develop the estimated regression equation by computing the values of b 0 and b 1 using equations (14.6) and (14.7) (to 1 decimal). = + x use the estimated regression equation to predict the value of y when x = 4 (to 1 decimal). =
Answers: 3
You know the right answer?
Questions in other subjects:


Computers and Technology, 30.08.2019 02:30


Chemistry, 30.08.2019 02:30
History, 30.08.2019 02:30


