
Mathematics, 11.11.2020 17:50 kyleap984ovm04g
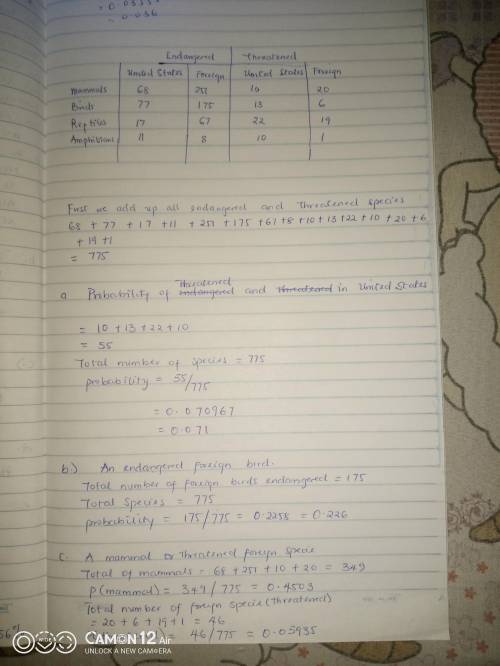
The chart below shows the numbers of endagered and threatened species both here in the United States and abroad
Endangered Threatened
United States Foreign United States Foreign
Mammals 68 251 10 20
Birds 77 175 13 6
Reptiles 17 67 22 19
Anphibians 11 8 10 1
Find the probability that it is:
a. Threatened and in the United States
b. An endangered foreign bird
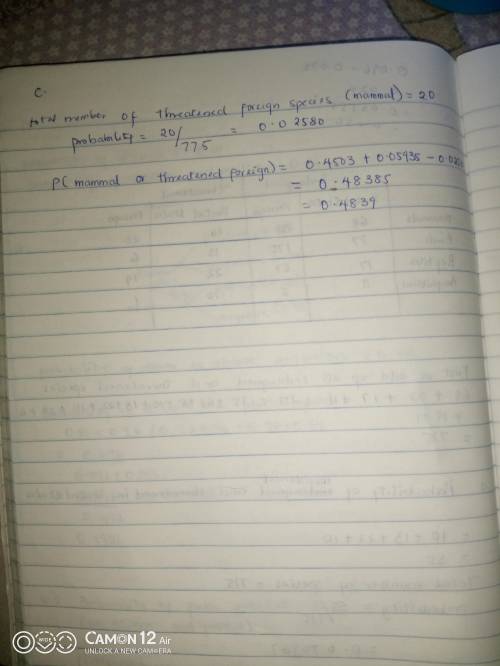
c. A mammal or a threatened foreign species

Answers: 1


Other questions on the subject: Mathematics
Mathematics, 21.06.2019 18:50, rosas8
Astudent draws two parabolas on graph paper. both parabolas cross the x-axis at (-4, 0) and (6,0). the y-intercept of thefirst parabola is (0, –12). the y-intercept of the second parabola is (0-24). what is the positive difference between the avalues for the two functions that describe the parabolas? write your answer as a decimal rounded to the nearest tenth.
Answers: 2
You know the right answer?
The chart below shows the numbers of endagered and threatened species both here in the United States...
Questions in other subjects:

Spanish, 16.10.2020 17:01
Mathematics, 16.10.2020 17:01

English, 16.10.2020 17:01


English, 16.10.2020 17:01


