
Mathematics, 11.11.2020 01:50 DerekMoncoal
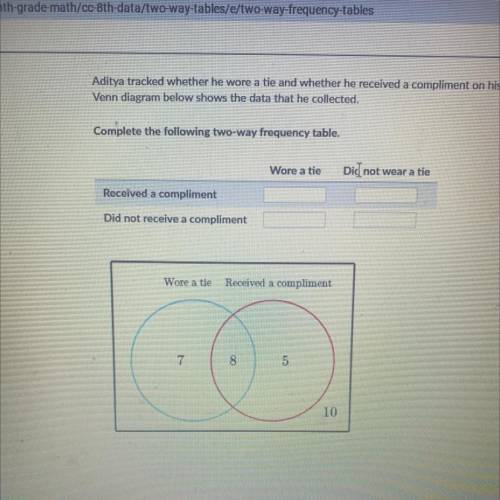
Aditya tracked whether he wore a tie and whether he received a compliment on his outfit for 30 days. The
Venn diagram below shows the data that he collected.
Complete the following two-way frequency table.

Answers: 3


Other questions on the subject: Mathematics
Mathematics, 21.06.2019 17:30, amiechap12
Let f(x) = x+3 and g(x) = 1/x the graph of (fog)(x) is shown below what is the range of (fog)(x)?
Answers: 2
Mathematics, 21.06.2019 23:20, ajbrock1004
In a small section of a stadium there are 40 spectators watching a game between the cook islands and fiji. they all support at least one of the two teams. 25 spectators support the cook islands and 16 of these support both teams. how many support only fiji?
Answers: 2
You know the right answer?
Aditya tracked whether he wore a tie and whether he received a compliment on his outfit for 30 days....
Questions in other subjects:
Mathematics, 15.01.2021 19:20

Chemistry, 15.01.2021 19:20
Mathematics, 15.01.2021 19:20
Mathematics, 15.01.2021 19:20
Mathematics, 15.01.2021 19:20


