
Mathematics, 10.11.2020 23:20 amandajbrewerdavis
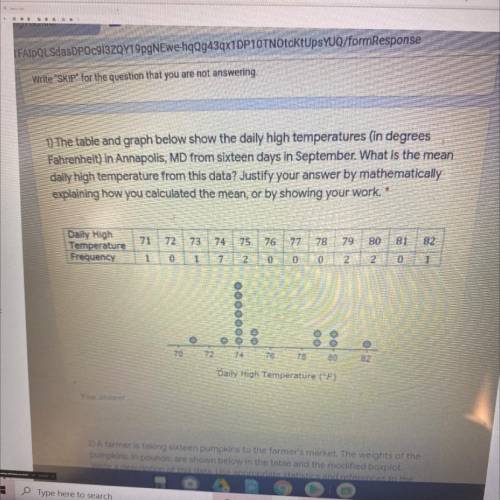
1) The table and graph below show the daily high temperatures (in degrees
Fahrenheit) in Annapolis, MD from sixteen days in September. What is the mean
daily high temperature from this data? Justify your answer by mathematically
explaining how you calculated the mean, or by showing your work.
76
77
78
79
80
81
82
Daily High
Temperature
Frequency
72 73 74 75
0 17 72
1
00
02
2
0
0000000/=
OO
00
OOS
70
76
SHO
78
Daily High Temperature (°F)

Answers: 3


Other questions on the subject: Mathematics
Mathematics, 21.06.2019 13:20, payshencec21
The ratio of two numbers is 5 to 4. the sum of the numbers is 99. what number is the greater of the two numbers?
Answers: 1
Mathematics, 21.06.2019 18:30, letsbestupidcx7734
Two cyclists 84 miles apart start riding toward each other at the samen time. one cycles 2 times as fast as the other. if they meet 4 hours later what is the speed (in miles) of the faster cyclists
Answers: 2
Mathematics, 21.06.2019 20:30, kalliebjones4511
Carley bought a jacket that was discounted 10% off the original price. the expression below represents the discounted price in dollars, based on x, the original price of the jacket.
Answers: 1
You know the right answer?
1) The table and graph below show the daily high temperatures (in degrees
Fahrenheit) in Annapolis,...
Questions in other subjects:


English, 30.10.2020 22:30
Mathematics, 30.10.2020 22:30

Health, 30.10.2020 22:30


