
Mathematics, 10.11.2020 22:10 kadenbaker4788
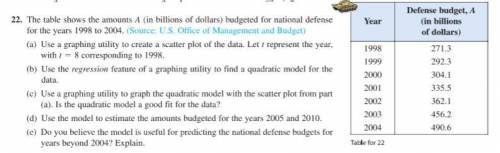
The table shows the amounts A budgeted for national defense for the years 1998 to 2004.
part a) Use a graphing utility to create a scatter plot of the data. Let t represent the year with t=8 corresponding to 1998.
part b) Use the regression feature of a graphing utility to find a quadratic model for the data.
part c) Use a graphing utility to graph the quadratic model with the scatter plot from part A. Is the quadratic model a good fit for the data?
part d) Use the model to estimate the amount budgeted for the years 2005 and 2010.
part e) Do you believe the model is useful for predicting the National Defense budgets for years beyond 2004? Explain.

Answers: 3


Other questions on the subject: Mathematics
Mathematics, 21.06.2019 22:30, gilcarrillo146
Micheal is 4 times as old as brandon and is also 27 years older than brandon. how old is micheal
Answers: 2
You know the right answer?
The table shows the amounts A budgeted for national defense for the years 1998 to 2004.
part a) Use...
Questions in other subjects:


Mathematics, 06.03.2022 17:30


Geography, 06.03.2022 17:30


