
Mathematics, 10.11.2020 18:30 Serenitybella
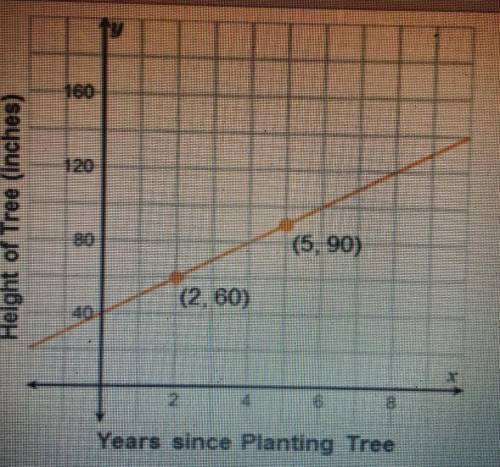
The graph shows the growth of a tree, with x representing the number of years since it was planted, and y representing the tree's height (in inches). Use the graph to analyze the tree's growth. Select all that apply
O The tree was 40 inches tall when planted.
O The tree's growth rate is 10 inches per year.
O The tree was 2 years old when planted. As it ages, the tree's growth rate slows
O Ten years after planting, it is 140 inches tall.

Answers: 1


Other questions on the subject: Mathematics
Mathematics, 21.06.2019 19:30, osnielabreu
The total ticket sales for a high school basketball game were $2,260. the ticket price for students were $2.25 less than the adult ticket price. the number of adult tickets sold was 230, and the number of student tickets sold was 180. what was the price of an adult ticket?
Answers: 2
Mathematics, 22.06.2019 00:30, angelyce4142
How can you check that you have correctly converted frequencies to relative frequencies?
Answers: 1
Mathematics, 22.06.2019 04:00, morgan4411
What is the distributive prperty to exspress 24+36
Answers: 1
You know the right answer?
The graph shows the growth of a tree, with x representing the number of years since it was planted,...
Questions in other subjects:


Chemistry, 13.04.2021 16:30

Health, 13.04.2021 16:30

Social Studies, 13.04.2021 16:30
Mathematics, 13.04.2021 16:30
Mathematics, 13.04.2021 16:30
Mathematics, 13.04.2021 16:30

History, 13.04.2021 16:30


