
Mathematics, 10.11.2020 02:00 britttttt03
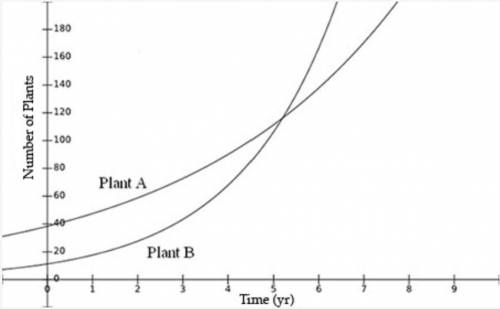
The following data were recorded while observing the increase in the number of strawberry plants produced in a field for two different varieties, Plant A and Plant B, and are graphed below.
Number of Strawberry Plants Produced in 5 Years
Year Plant A Plant B
0 40 10
1 48 18
2 54 26
3 72 39
4 90 63
5 109 100
(graph at bottom)
In the long term, which plant should the strawberry farmer grow to maximize the number of new plants produced?
Plant A, because it has more plants to begin with and, according to the graph, is better in the long term
Plant A, because it has a greater percentage growth rate and, according to the graph, is better in the long term
Plant B, because it has less plants to begin with and, according to the graph, is better in the long term
Plant B, because it has a greater percentage growth rate and, according to the graph, is better in the long term

Answers: 2


Other questions on the subject: Mathematics
Mathematics, 21.06.2019 19:00, Patricia2121
Me with geometry ! in this figure, bc is a perpendicular bisects of kj. dm is the angle bisects of bdj. what is the measure of bdm? •60° •90° •30° •45°
Answers: 2
Mathematics, 22.06.2019 01:30, snikergrace
What rule describes a dilation with a scale factor of 4 and the center of dilation at the origin?
Answers: 1
You know the right answer?
The following data were recorded while observing the increase in the number of strawberry plants pro...
Questions in other subjects:

Biology, 09.03.2021 21:10

Chemistry, 09.03.2021 21:10
Mathematics, 09.03.2021 21:10
Mathematics, 09.03.2021 21:10
Biology, 09.03.2021 21:10

History, 09.03.2021 21:10

Social Studies, 09.03.2021 21:10


