
Mathematics, 10.11.2020 01:50 lillianradecki
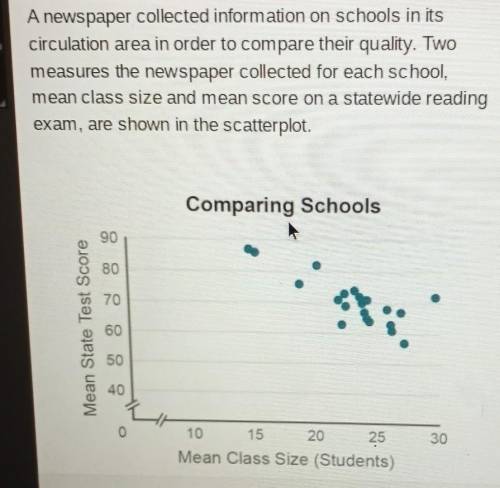
Which statement regarding the association shown could explain the relationship?
A. class size appears to have little effect on test scores.
B. schools is more affluent areas have larger class sizes, which is associated with higher test scores.
C. schools in more affluent areas have smaller class sizes, which is associated with higher test scores.
D. schools in less affluent areas have smaller class sizes, which is associated with lower test scores.

Answers: 3


Other questions on the subject: Mathematics
Mathematics, 21.06.2019 22:10, alishadautreuil
In which direction does the left side of the graph of this function point? a(x) = 3x - x2 + 4x - 2
Answers: 3
Mathematics, 21.06.2019 22:40, michaellagann2020
Adeli owner keeps track of the to-go orders each day. the results from last saturday are shown in the given two-way frequency table. saturday's to-go deli orders in person by phone online total pick up 38 25 31 94 delivery 35 28 34 97 total 73 53 65 191 what percent of the to-go orders were delivery orders placed by phone? a. 14.66% b. 38.41% c. 28.87% d. 52.83%
Answers: 2
Mathematics, 22.06.2019 00:00, olgapagan1010
At noon a tank contained 10cm water. after several hours it contained 7cm of water. what is the percent decrease of water in the tank?
Answers: 1
Mathematics, 22.06.2019 01:30, jude40
Asample of 200 rom computer chips was selected on each of 30 consecutive days, and the number of nonconforming chips on each day was as follows: the data has been given so that it can be copied into r as a vector. non. conforming = c(10, 15, 21, 19, 34, 16, 5, 24, 8, 21, 32, 14, 14, 19, 18, 20, 12, 23, 10, 19, 20, 18, 13, 26, 33, 14, 12, 21, 12, 27) #construct a p chart by using the following code. you will need to enter your values for pbar, lcl and ucl. pbar = lcl = ucl = plot(non. conforming/200, ylim = c(0,.5)) abline(h = pbar, lty = 2) abline(h = lcl, lty = 3) abline(h = ucl, lty = 3)
Answers: 3
You know the right answer?
Which statement regarding the association shown could explain the relationship?
A. class size appea...
Questions in other subjects:


Mathematics, 07.01.2021 22:20

World Languages, 07.01.2021 22:20
Mathematics, 07.01.2021 22:20
Mathematics, 07.01.2021 22:20
Mathematics, 07.01.2021 22:20


