Blue
Red
600
500
2
M
400
N
300
200
o
R<...

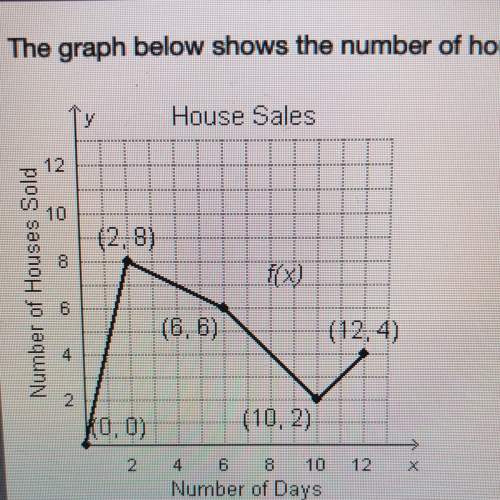
Mathematics, 10.11.2020 01:20 hernsl0263
Blue
Red
600
500
2
M
400
N
300
200
o
R
100
0
100
200
300
400
500
600
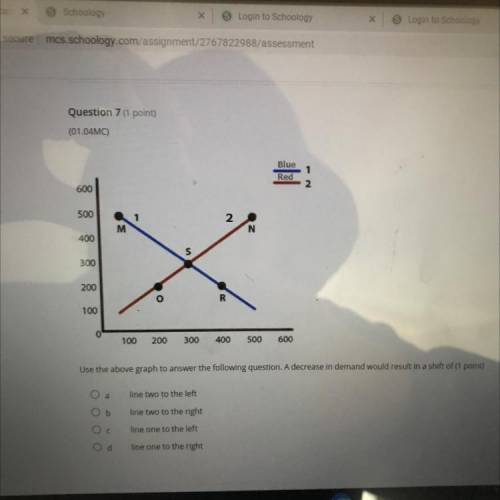
Use the above graph to answer the following question. A decrease in demand would result in a shift of (1 point)
O a
line two to the left
Oь
two to the right
Ос
line one to the left
line one to the right

Answers: 2


Other questions on the subject: Mathematics
Mathematics, 21.06.2019 19:00, hanahspeers
If f(x)= sqrt4x+9+2, which inequality can be used to find the domain of f(x)?
Answers: 2
Mathematics, 21.06.2019 23:30, QuestionAsker4356
Hundred and tens tables to make 430 in five different ways
Answers: 1
You know the right answer?
Questions in other subjects:

Mathematics, 09.11.2020 22:50
Mathematics, 09.11.2020 22:50
Mathematics, 09.11.2020 22:50

Mathematics, 09.11.2020 22:50


