
Mathematics, 09.11.2020 02:40 Loowkeychrissy7227
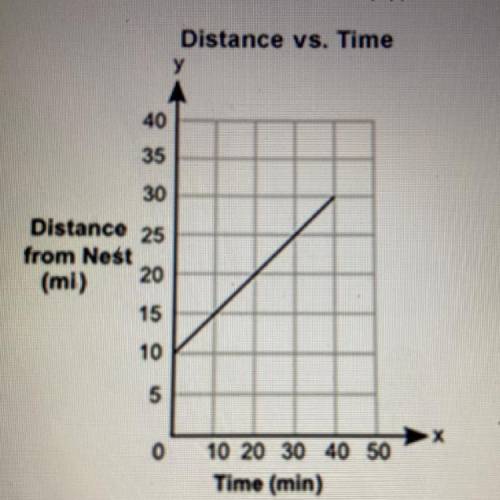
The graph shows the distance, y, in miles, of a bird from its nest over a certain amount of time, x, in minutes.
Based on the graph, what is the initial value of the graph and what does it represent?
0.5 mile per minute; it represents the speed of the bird.
0.5 mile; it represents the original distance of the bird from its nest.
10 miles; it represents the original distance of the bird from its nest.
10 miles per minute; it represents the speed of the bird.

Answers: 2


Other questions on the subject: Mathematics
Mathematics, 22.06.2019 00:20, Imagine2013
Given sin28.4=.4756, cos28.4=.8796, and tan28.4=.5407 find the cos of 61.6
Answers: 2
You know the right answer?
The graph shows the distance, y, in miles, of a bird from its nest over a certain amount of time, x,...
Questions in other subjects:

Social Studies, 23.11.2020 01:00

Computers and Technology, 23.11.2020 01:00

Law, 23.11.2020 01:00
Mathematics, 23.11.2020 01:00

Chemistry, 23.11.2020 01:00


