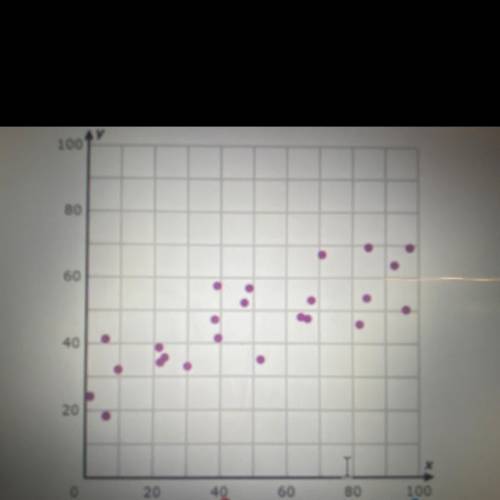
For the following scatter plot, interpret the type of trend the
data set will hold.
1.P...

Mathematics, 08.11.2020 03:10 shmueller1554
For the following scatter plot, interpret the type of trend the
data set will hold.
1.Positive
2.Negative
3.No trend

Answers: 3


Other questions on the subject: Mathematics
Mathematics, 21.06.2019 19:30, cutegirl0987
Given a: b and b: c, find a: b: c. write the ratio in simplest form. a: b=6: 10 and b: c=21: 33
Answers: 1
Mathematics, 21.06.2019 20:00, sanafarghal
Find the value of x. give reasons to justify your solutions! l, m ∈ kn
Answers: 3
Mathematics, 21.06.2019 22:30, murdocksfamilyouoxvm
Adeposit of 5500 at 6% for 3 years equals
Answers: 2
You know the right answer?
Questions in other subjects:
Mathematics, 31.07.2020 05:01


Biology, 31.07.2020 05:01


