
Mathematics, 08.11.2020 01:00 reearamrup27
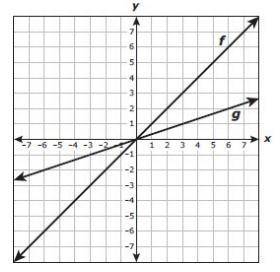
The graphs of linear functions f and g are shown on the grid.
Which function is best represented by the graph of g?
A g(x) = f(x) − 4
B g(x) = 1/3 f(x)
C g(x) = f(x) − 2
D g(x) = 3f(x)

Answers: 2


Other questions on the subject: Mathematics
Mathematics, 21.06.2019 19:30, MariaIZweird7578
Combine the information in the problem and the chart using the average balance method to solve the problem.
Answers: 2
Mathematics, 21.06.2019 20:00, rogelionavarro200314
Evaluate the discriminant of each equation. tell how many solutions each equation has and whether the solutions are real or imaginary. x^2 + 4x + 5 = 0
Answers: 2
Mathematics, 21.06.2019 23:10, toricepeda82
In which quadrant does the point lie? write the coordinates of the point. a. quadrant ii; (–2, –4) b. quadrant iii; (2, 4) c. quadrant iii; (–2, –4) d. quadrant iv; (–4, –2)
Answers: 3
You know the right answer?
The graphs of linear functions f and g are shown on the grid.
Which function is best represented by...
Questions in other subjects:

Chemistry, 27.01.2021 07:20
Mathematics, 27.01.2021 07:20
Mathematics, 27.01.2021 07:20


Mathematics, 27.01.2021 07:20


