
Mathematics, 07.11.2020 20:40 dxnimxriee
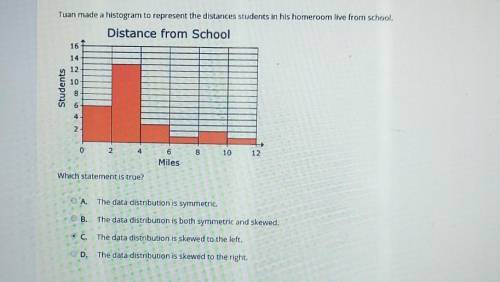
fast 30 points Select the correct answer. Tuan made a histogram to represent the distances students in his homeroom live from school. Distance from School 16 14 12 10 Students NA 000 N 4 6 8 10 12 Miles Which statement is true? A. The data distribution is symmetric. B. The data distribution is both symmetric and skewed. O C. The data distribution is skewed to the left. D. The data distribution is skewed to the right.

Answers: 1


Other questions on the subject: Mathematics
Mathematics, 21.06.2019 12:50, shelbylynn17
Given this information, which expression must represent the value of b?
Answers: 1
Mathematics, 21.06.2019 21:30, jerenasmith77
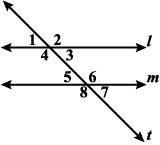
Are the corresponding angles congruent? explain why or why not.
Answers: 2
Mathematics, 22.06.2019 01:40, Anshuman2002
(co 3) the soup produced by a company has a salt level that is normally distributed with a mean of 5.4 grams and a standard deviation of 0.3 grams. the company takes readings of every 10th bar off the production line. the reading points are 5.8, 5.9, 4.9, 6.5, 5.0, 4.9, 6.2, 5.1, 5.7, 6.1. is the process in control or out of control and why? it is out of control as two of these data points are more than 2 standard deviations from the mean it is in control as the data points more than 2 standard deviations from the mean are far apart it is out of control as one of these data points is more than 3 standard deviations from the mean it is in control as the values jump above and below the mean
Answers: 2
You know the right answer?
fast 30 points Select the correct answer. Tuan made a histogram to represent the distances students...
Questions in other subjects:

Mathematics, 09.09.2021 22:20

Mathematics, 09.09.2021 22:20


Computers and Technology, 09.09.2021 22:20


