
Mathematics, 07.11.2020 01:00 lexiemornelas
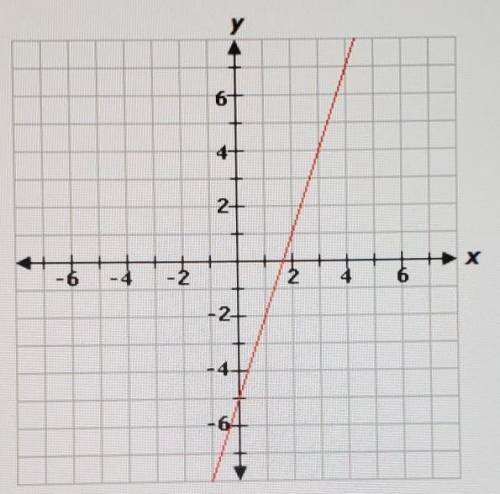
Consider the function f(x) = 3x + 1 and the graph of the function g(x) shown.
The graph g(x) is the graph of f(x) translated __ units __, and g(x) = __
Options for the first blank: 5, 3, or 2
Options for the second blank: right, left, up, or down
Options for the third blank: f(x - 3), f(x) - 5, f(x) + 3, f(x + 5), f(x - 2), or f(x) + 2

Answers: 2


Other questions on the subject: Mathematics
Mathematics, 21.06.2019 16:00, loyaltyandgood
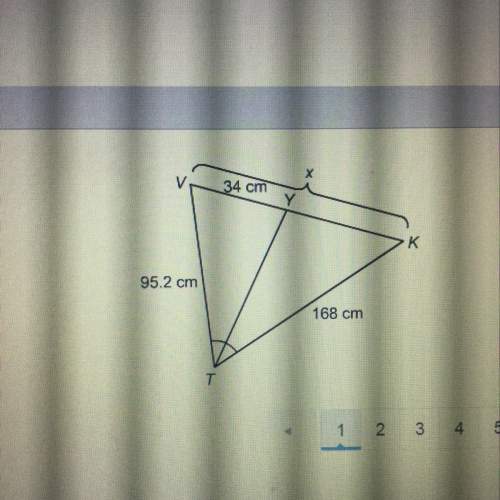
Which segments are congruent? o jn and ln o jn and nm o in and nk onk and nm
Answers: 3
Mathematics, 21.06.2019 19:30, tiwaribianca475
Cor d? ? me ? max recorded the heights of 500 male humans. he found that the heights were normally distributed around a mean of 177 centimeters. which statements about max’s data must be true? a) the median of max’s data is 250 b) more than half of the data points max recorded were 177 centimeters. c) a data point chosen at random is as likely to be above the mean as it is to be below the mean. d) every height within three standard deviations of the mean is equally likely to be chosen if a data point is selected at random.
Answers: 1
You know the right answer?
Consider the function f(x) = 3x + 1 and the graph of the function g(x) shown.
The graph g(x) is the...
Questions in other subjects:


History, 15.07.2020 04:01


