
Mathematics, 06.11.2020 23:50 Milosmom
Deslom
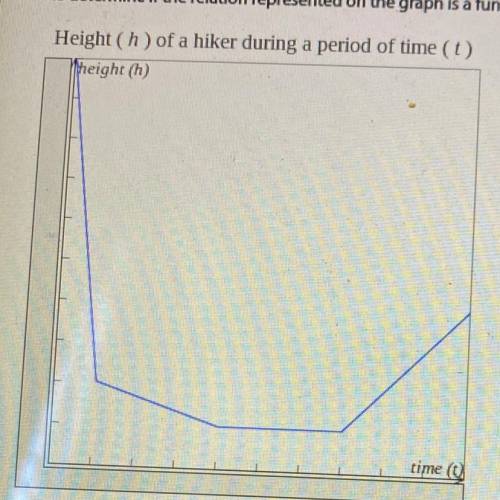
The graph shown represents the height (h) of a hiker during a period of time (t). Use the vertical line test
to determine if the relation represented on the graph is a function. Complete the explanation.
Height (h) of a hiker during a period of time (1)
Mheight (h)
time
v the vertical line test.
Since a vertical line will pass through more than one point, the graph ?
So, the relation ? va function.

Answers: 2


Other questions on the subject: Mathematics
Mathematics, 21.06.2019 19:30, ruddymorales1123
If y varies directly as x2 and y=6 when x=6, find the constant of variation.
Answers: 2
Mathematics, 21.06.2019 22:00, victordguerrero2535
Serena is making an experiment. for that, she needs 20 grams of a 52% solution of salt. she has two large bottles of salt water: one with 40% and the other with 70% of salt in them. how much of each must she use to make the solution she needs? i am in need of
Answers: 1
Mathematics, 21.06.2019 23:00, kealalac1
Afunction, f(x), represents the height of a plant x months after being planted. students measure and record the height on a monthly basis. select the appropriate domain for this situation. a. the set of all positive real numbers b. the set of all integers oc. the set of all positive integers od. the set of all real numbers reset next
Answers: 3
You know the right answer?
Deslom
The graph shown represents the height (h) of a hiker during a period of time (t). Use the ve...
Questions in other subjects:


Chemistry, 12.02.2021 09:40
Mathematics, 12.02.2021 09:40
Mathematics, 12.02.2021 09:40


