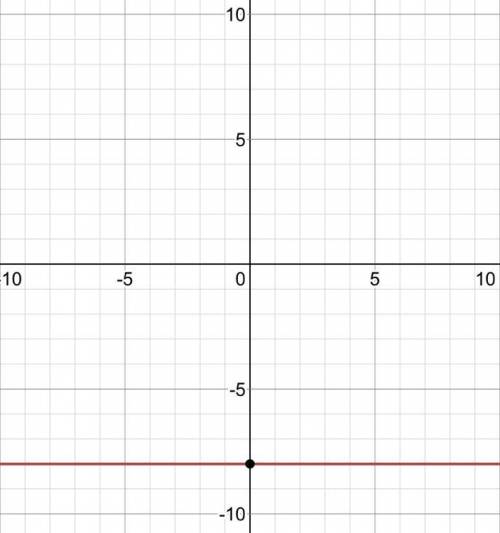
Graph the line y=-8.
PLEASE HELP ASAP...

Mathematics, 06.11.2020 22:10 tdahna0403
Graph the line y=-8.
PLEASE HELP ASAP

Answers: 3


Other questions on the subject: Mathematics
Mathematics, 21.06.2019 12:50, xojade
Plz, ! the box plot below shows the total amount of time, in minutes, the students of a class surf the internet every day: a box plot is shown. part a: list two pieces of information that are provided by the graph and one piece of information that is not provided by the graph. (4 points) part b: calculate the interquartile range of the data, and explain in a sentence or two what it represents. (4 points) part c: explain what affect, if any, there will be if an outlier is present. (2 points)
Answers: 3
Mathematics, 21.06.2019 17:00, adreyan6221
Acylinder and its dimensions are shown. which equation can be used to find v, the volume of the cylinder in cubic centimeters?
Answers: 1
Mathematics, 21.06.2019 17:30, NarutoBeast8049
For each proportion find the unknown number x 1/5/8=×/15
Answers: 1
You know the right answer?
Questions in other subjects:

English, 12.03.2021 16:10

History, 12.03.2021 16:10
Mathematics, 12.03.2021 16:10
Mathematics, 12.03.2021 16:10


