
Mathematics, 06.11.2020 17:50 liltay12386
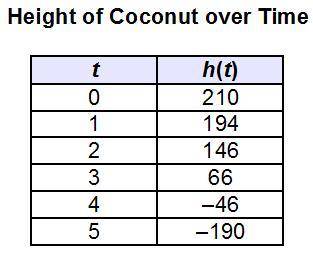
Marlena created a table of values representing the height in feet, h(t), of a coconut falling to the hard ground with a height of 0 feet, collected over t seconds. Assume the coconut does not bounce.
Which statement is true?
The initial height of the coconut is 190 feet.
The coconut will hit the ground between 4 and 5 seconds after it was dropped.
The values of h(t) when t = 4 and 5 should be 0.
The maximum height of the coconut was 1 second after it was dropped.

Answers: 2


Other questions on the subject: Mathematics
Mathematics, 21.06.2019 17:10, sanchez626
Determine whether the points (–3,–6) and (2,–8) are in the solution set of the system of inequalities below. x ? –3 y < 5? 3x + 2 a. the point (–3,–6) is not in the solution set, and the point (2,–8) is in the solution set. b. neither of the points is in the solution set. c. the point (–3,–6) is in the solution set, and the point (2,–8) is not in the solution set. d. both points are in the solution set.
Answers: 3
Mathematics, 21.06.2019 19:30, ray2220
The position of a moving particle is given by the position function: f(t)=-9t-t^2-0.2t^3+0.1t^4 a. at what time does the particle reverse direction? b. when is the displacement positive? (round one decimal place and answer in interval notation) c. when is the displacement negative? (round one decimal place and answer in interval notation) d. when is the particle’s acceleration positive? (round one decimal place and answer in interval notation) e. when is the particle’s acceleration negative? (round one decimal place and answer in interval notation)
Answers: 3
Mathematics, 21.06.2019 19:50, nawafcanada
On a piece of paper graft y+2> -3x-3 then determine which answer matches the graph you drew
Answers: 2
Mathematics, 21.06.2019 20:20, leximae2186
Consider the following estimates from the early 2010s of shares of income to each group. country poorest 40% next 30% richest 30% bolivia 10 25 65 chile 10 20 70 uruguay 20 30 50 1.) using the 4-point curved line drawing tool, plot the lorenz curve for bolivia. properly label your curve. 2.) using the 4-point curved line drawing tool, plot the lorenz curve for uruguay. properly label your curve.
Answers: 2
You know the right answer?
Marlena created a table of values representing the height in feet, h(t), of a coconut falling to the...
Questions in other subjects:
Mathematics, 31.12.2019 13:31


Social Studies, 31.12.2019 13:31


History, 31.12.2019 13:31
Mathematics, 31.12.2019 13:31


