
Mathematics, 06.11.2020 08:30 emma8292
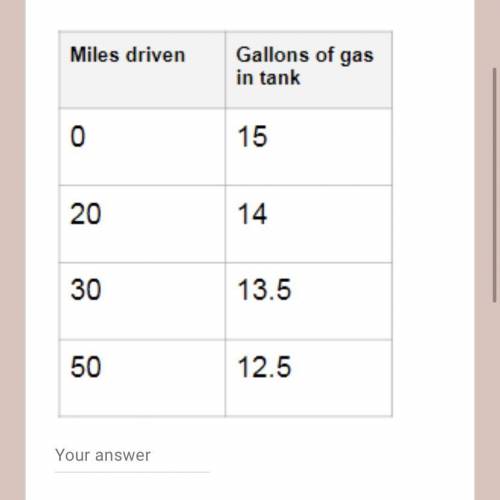
The data below could be plotted on a graph to create a linear relationship. What would be the slope of the line that relates miles driven (x) to gallons of gasoline in the tank (y)?

Answers: 3


Other questions on the subject: Mathematics
Mathematics, 21.06.2019 21:50, destinyharris8502
Which is the graph of this function 3 square root of x plus one if
Answers: 1
You know the right answer?
The data below could be plotted on a graph to create a linear relationship. What would be the slope...
Questions in other subjects:


History, 30.11.2020 21:40

Geography, 30.11.2020 21:40

Mathematics, 30.11.2020 21:40


