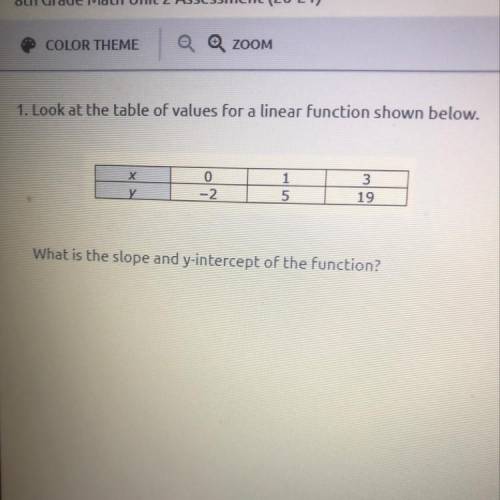
1. Look at the table of values for a linear function shown below.
х
у
0
-2
...

Mathematics, 05.11.2020 23:20 Yuii
1. Look at the table of values for a linear function shown below.
х
у
0
-2
1
5
3
19
What is the slope and y-intercept of the function?

Answers: 3


Other questions on the subject: Mathematics
Mathematics, 22.06.2019 01:20, blackboy21
1. why is a frequency distribution useful? it allows researchers to see the "shape" of the data. it tells researchers how often the mean occurs in a set of data. it can visually identify the mean. it ignores outliers. 2. the is defined by its mean and standard deviation alone. normal distribution frequency distribution median distribution marginal distribution 3. approximately % of the data in a given sample falls within three standard deviations of the mean if it is normally distributed. 95 68 34 99 4. a data set is said to be if the mean of the data is greater than the median of the data. normally distributed frequency distributed right-skewed left-skewed
Answers: 2
Mathematics, 22.06.2019 04:30, ayoismeisalex
How many zeroes do we write when we write all the integers 1 to 243 in base 3?
Answers: 1
Mathematics, 22.06.2019 05:00, globalremix
Lena draws a square with an area that is greater than the area of rectangle b. what are two possible side lengths of lena's square? explain.
Answers: 3
You know the right answer?
Questions in other subjects:


Health, 26.07.2019 07:00

Mathematics, 26.07.2019 07:00


Biology, 26.07.2019 07:00


