
Mathematics, 05.11.2020 14:00 Ajaxr3175
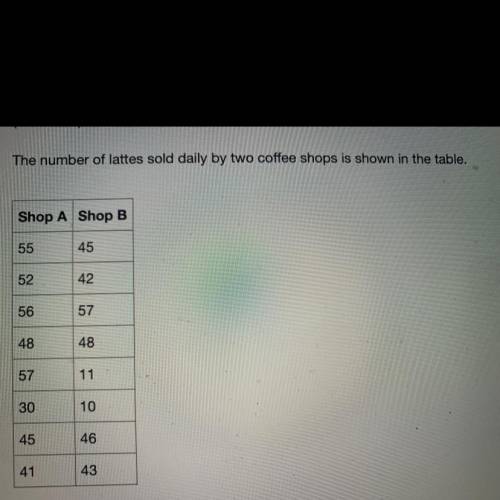
The number of lattes sold daily by two coffee shops is shown in the table.
Based on these data, is it better to describe the centers of distribution in terms of the mean or median?explain.
A)mean for both coffee shops because the data distribution is symmetric
B)median for both coffee shops because the data distribution is not symmetric
C)mean for shop B because the data distribution is symmetric;median for shop A because the data distribution is not symmetric
D)mean for shop A because the data distribution is symmetric;median for shop B because the data distribution is not symmetric

Answers: 2


Other questions on the subject: Mathematics
Mathematics, 21.06.2019 18:00, keidyhernandezm
List the sides of δrst in in ascending order (shortest to longest) if: a ∠r =x+28°, m∠s = 2x+16°, and m∠t = x+12°
Answers: 2
You know the right answer?
The number of lattes sold daily by two coffee shops is shown in the table.
Based on these data, is...
Questions in other subjects:
Mathematics, 09.03.2021 19:30
Mathematics, 09.03.2021 19:30

English, 09.03.2021 19:30
Mathematics, 09.03.2021 19:30


History, 09.03.2021 19:30


