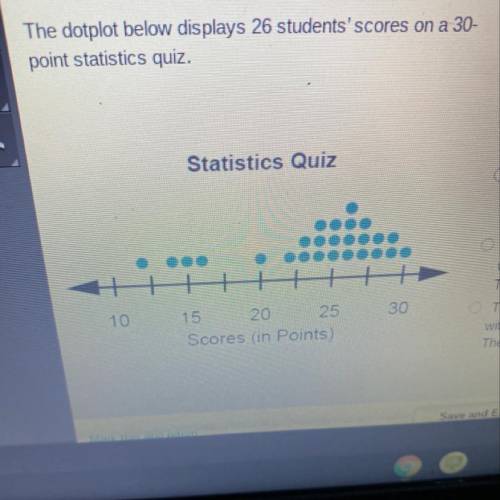
The dotplot below displays 26 students' scores on a 30-
point statistics quiz.
Which of the f...

Mathematics, 04.11.2020 23:30 garcikyl000
The dotplot below displays 26 students' scores on a 30-
point statistics quiz.
Which of the following statements best describes the
dotplot?
Statistics Quiz
The distribution of quiz scores is skewed left with a
center around 24 and varies from 12 to 30. There are
possible outliers at 12, 14, 15, and 16.
The distribution of quiz scores is skewed right with a
center around 24 and varies from 12 to 30. There are
possible outliers at 12, 14, 15, and 16.
The distribution of quiz scores is unimodal symmetric
with a center around 24 and varies from 12 to 30.
There are possible outliers at 12, 14, 15, and 16.
The distribution of quiz scores is unimodal symmetric
with a center around 26 and varies from 20 to 30.
There are possible outliers at 12, 14, 15, and 16.
10
30
15 20 25
Scores (in Points)

Answers: 1


Other questions on the subject: Mathematics
Mathematics, 21.06.2019 20:30, donnafranks2003
If g^-1(x) is the inverse of g (x) which statement must be true
Answers: 3
Mathematics, 22.06.2019 00:30, qqbear4555
(c) a vine called the mile-a-minute weed is known for growing at a very fast rate. it can grow up to 0.5 ft per day. how fast in inches per hour can the mile-a-minute weed grow up to? show your work using the correct conversion factors.
Answers: 1
Mathematics, 22.06.2019 00:40, Hjackson24
What is the interquartile range (iqr) of the data set represented by this box plot?
Answers: 3
Mathematics, 22.06.2019 03:00, Benjamincompton07
At a soccer tournament 1212 teams are wearing red shirts, 66 teams are wearing blue shirts, 44 teams are wearing orange shirts, and 22 teams are wearing white shirts. for every 22 teams at the tournament, there is 1 team wearing shirts. choose 1
Answers: 2
You know the right answer?
Questions in other subjects:

Physics, 18.10.2019 20:40


Business, 18.10.2019 20:40

Social Studies, 18.10.2019 20:40
Social Studies, 18.10.2019 20:40


Mathematics, 18.10.2019 20:40
Mathematics, 18.10.2019 20:40


