
Mathematics, 04.11.2020 23:10 hannahelisabeth19
The following table gives values of the differentiable function y=f(x).
x 0 1 2 3 4 5 6 7 8 9 10
y 2 4 6 7 5 -2 -1 1 3 4 6
Estimate the x-values of critical points of f(x) on the interval 0
(Enter your critical points as comma-separated xvalue, classification pairs. For example, if you found the critical points x=−2 and x=3, and that the first was a local minimum and the second neither a minimum nor a maximum, you should enter (-2,min), (3,neither). Enter none if there are no critical points.)
critical points and classifications:
Now assume that the table gives values of the continuous function y=f′(x) (instead of f(x)). Estimate and classify critical points of the function f(x).
critical points and classifications:

Answers: 1


Other questions on the subject: Mathematics
Mathematics, 21.06.2019 18:40, banditballer2
Complete the steps, which describe how to find the area of the shaded portion of the circle. find the area of the sector by multiplying the area of the circle by the ratio of the to 360. subtract the area of the triangle from the area of the sector.
Answers: 3
Mathematics, 21.06.2019 21:00, CoolDudeTrist
Construct the graph that models the given situation
Answers: 1
Mathematics, 21.06.2019 21:30, shymitch32
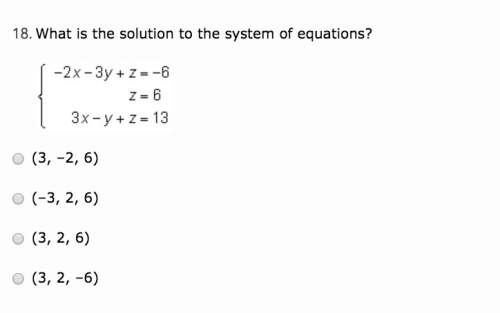
Create a graph for the demand for starfish using the following data table: quantity/price of starfish quantity (x axis) of starfish in dozens price (y axis) of starfish per dozen 0 8 2 6 3 5 5 2 7 1 9 0 is the relationship between the price of starfish and the quantity demanded inverse or direct? why? how many dozens of starfish are demanded at a price of five? calculate the slope of the line between the prices of 6 (quantity of 2) and 1 (quantity of 7) per dozen. describe the line when there is a direct relationship between price and quantity.
Answers: 3
Mathematics, 21.06.2019 22:00, prishnasharma34
The two box p digram the two box plots show the data of the pitches thrown by two pitchers throughout the season. which statement is correct? check all that apply. pitcher 1 has a symmetric data set. pitcher 1 does not have a symmetric data set. pitcher 2 has a symmetric data set. pitcher 2 does not have a symmetric data set. pitcher 2 has the greater variation. ots represent the total number of touchdowns two quarterbacks threw in 10 seasons of play
Answers: 1
You know the right answer?
The following table gives values of the differentiable function y=f(x).
x 0 1 2 3 4 5 6 7 8 9 10
Questions in other subjects:
Mathematics, 08.10.2021 09:40
Mathematics, 08.10.2021 09:40


English, 08.10.2021 09:40
Mathematics, 08.10.2021 09:40

Medicine, 08.10.2021 09:40

History, 08.10.2021 09:40
History, 08.10.2021 09:40


