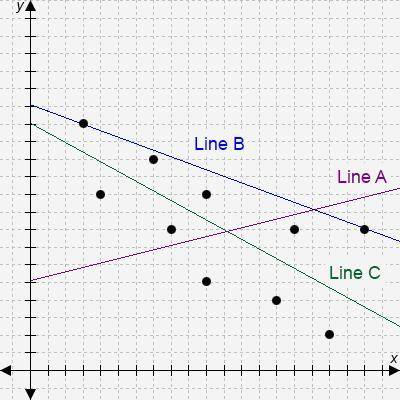
Consider this scatter plot.
Which line best fits the data?
line C
line A
No...

Mathematics, 04.11.2020 20:50 TheRunningPotatoe245
Consider this scatter plot.
Which line best fits the data?
line C
line A
None of the lines fit the data well.
line B

Answers: 1


Other questions on the subject: Mathematics
Mathematics, 21.06.2019 15:20, heyrosaphoto3159
The speed of a falling object increases at a constant rate as time increases since the object was dropped. which graph could represent the relationship betweent time in seconds, and s, speed in meters per second? speed of a falling object object over time
Answers: 1
Mathematics, 21.06.2019 17:20, ryleepretty
Two language majors, anna and megan, took exams in two languages. anna scored 85 on both exams. megan scored 74 on the first exam and 85 on the second exam. overall, student scores on the first exam had a mean of 82 and a standard deviation of 4, and the second exam scores had a mean of 71 and a standard deviation of 13. a) to qualify for language honors, a major must maintain at least an 85 average across all language courses taken. so far, which of anna and megan qualify? b) which student's overall performance was better?
Answers: 2
Mathematics, 21.06.2019 19:30, fraven1819
:24% of students in a class are girls. if there are less than 30 students in this class, how many students are there? how many girls are there?
Answers: 2
You know the right answer?
Questions in other subjects:

Mathematics, 20.07.2020 16:01
Mathematics, 20.07.2020 16:01

Biology, 20.07.2020 16:01


Mathematics, 20.07.2020 16:01

Business, 20.07.2020 16:01


