
Mathematics, 04.11.2020 17:30 qawsedrftgyh3487
You keep track of the daily hot chocolate sales and the outside temperature each day. The data you gathered is shown in the data table below.
Hot Chocolate Sales and Outside Temperatures
Sales ($)
$100
$213
$830
$679
$209
$189
$1,110
$456
$422
$235
$199
Temperature (°F)
92°
88°
54°
62°
85°
16°
52°
65°
68°
89°
91°
a) Make a scatterplot of the data above. (2 points)

Answers: 2
 Temperature
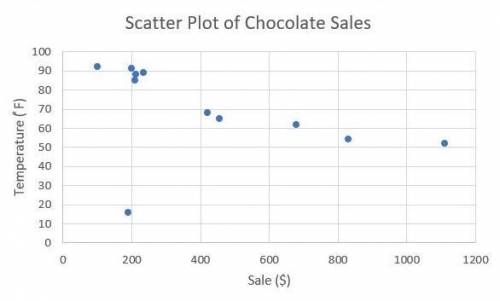


Other questions on the subject: Mathematics
Mathematics, 22.06.2019 01:00, tansebas1107
The table shown below gives the approximate enrollment at the university of michigan every fifty years. how many more students were enrolled at the university of michigan in 1950 than in 1900?
Answers: 3
You know the right answer?
You keep track of the daily hot chocolate sales and the outside temperature each day. The data you g...
Questions in other subjects:
Mathematics, 26.07.2019 08:00

History, 26.07.2019 08:00
History, 26.07.2019 08:00

Mathematics, 26.07.2019 08:00
Mathematics, 26.07.2019 08:00
Mathematics, 26.07.2019 08:00

Biology, 26.07.2019 08:00


