
Mathematics, 04.11.2020 07:50 alayciaruffin076
Question 4
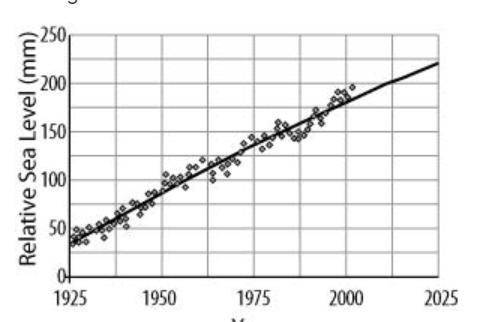
The figure shows the actual increase in sea level between the years 1925 and 2000 (shown by the points) and a mathematical model that has been fitted to the data (shown by the line).
image 5afdca68eca248c59dbe6c57ceabf51b
Based on the model in the graph, which is the best estimate of the average annual increase in sea level expected between the years 2000 and 2025?
A
1.6 mm/year
B
1.9 mm/year
C
40 mm/year
D
150 mm/year

Answers: 3


Other questions on the subject: Mathematics
Mathematics, 21.06.2019 17:30, bradleycawley02
Lems1. the following data set represents the scores on intelligence quotient(iq) examinations of 40 sixth-grade students at a particular school: 114, 122, 103, 118, 99, 105, 134, 125, 117, 106, 109, 104, 111, 127,133, 111, 117, 103, 120, 98, 100, 130, 141, 119, 128, 106, 109, 115,113, 121, 100, 130, 125, 117, 119, 113, 104, 108, 110, 102(a) present this data set in a frequency histogram.(b) which class interval contains the greatest number of data values? (c) is there a roughly equal number of data in each class interval? (d) does the histogram appear to be approximately symmetric? if so, about which interval is it approximately symmetric?
Answers: 3
Mathematics, 21.06.2019 18:50, garrettcameron12
Given: pqrs is a parallelogram prove: pr and qs bisect each other at t
Answers: 1
Mathematics, 21.06.2019 19:00, gharrell03
Satchi found a used bookstore that sells pre-owned dvds and cds. dvds cost $9 each, and cds cost $7 each. satchi can spend no more than $45.
Answers: 1
You know the right answer?
Question 4
The figure shows the actual increase in sea level between the years 1925 and 2000 (shown...
Questions in other subjects:

Mathematics, 10.03.2021 06:40


Arts, 10.03.2021 06:40
History, 10.03.2021 06:40
Mathematics, 10.03.2021 06:40
Mathematics, 10.03.2021 06:40


