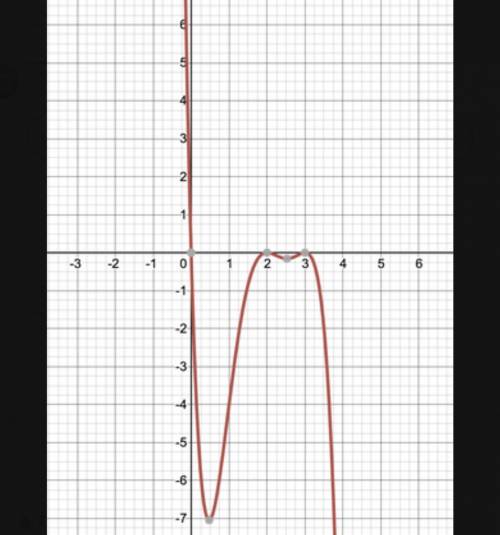
Can anyone find the function of this graph
...

Mathematics, 03.11.2020 01:20 jhaveen8335
Can anyone find the function of this graph

Answers: 2


Other questions on the subject: Mathematics
Mathematics, 22.06.2019 03:00, travisvb
Will give the box plots below show the math scores of students in two different classes: class a 55 72 75 89 95 class b 55 70 75 94 100 based on the box plots, which statement is correct? a: the median score of class a is greater than the median score of class b. b: the lower quartile of class a is greater than the lower quartile of class b. c: the upper quartile of class a is greater than the upper quartile of class b. d: the maximum score of class a is greater than the maximum score of class b.
Answers: 1
Mathematics, 22.06.2019 05:50, eliarnol9517
Type the correct answer in each box. use numerals instead of words. if necessary, use / for the fraction bar(s). line m has no y-intercept, and its x-intercept is (3, 0). line n has no x-intercept, and its y-intercept is (0, -4). the equation of line m is , and the equation of line n is .
Answers: 1
You know the right answer?
Questions in other subjects:


Health, 15.10.2020 19:01
Mathematics, 15.10.2020 19:01
Mathematics, 15.10.2020 19:01

Business, 15.10.2020 19:01

History, 15.10.2020 19:01
Physics, 15.10.2020 19:01

Biology, 15.10.2020 19:01


