
Mathematics, 03.11.2020 01:00 rissaroo159
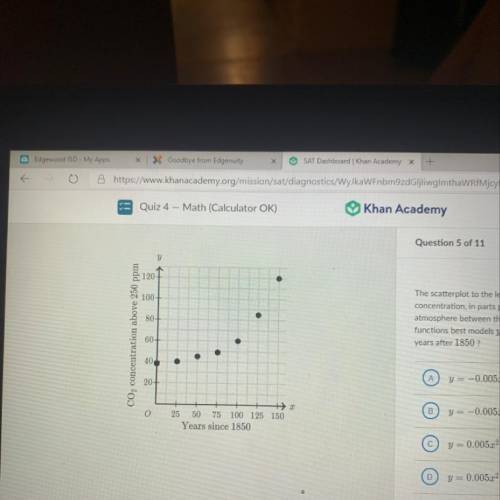
The scatterplot to the left depicts the carbon dioxide (CO2)
concentration, in parts per million (ppm) above 250 ppm, in Earth's
atmosphere between the years 1850 and 2000. Which of the following
functions best models y, the CO2 concentration above 250 ppm, 3
years after 1850 ?
y = -0.00522 - 0.296x - 39.430
y = -0.00522 - 0.296x + 39.430
y = 0.005x2 - 0.2962 – 39.430
y = 0.005x2 - 0.2962 + 39.430
I would be guessing.

Answers: 3


Other questions on the subject: Mathematics
Mathematics, 21.06.2019 19:00, babygirlmiller
The weight of an object in the water is 7% of its weight out of the water. what is the weight of a 652g object in the water?
Answers: 1
Mathematics, 21.06.2019 20:30, kingdesto3481
The function v(r)=4/3pir^3 can be used to find the volume of air inside a basketball given its radius. what does v(r) represent
Answers: 1
Mathematics, 22.06.2019 00:20, yoyo80431
Sherrie is baking a pie for her family. she leaves the room and comes back to 35% of the pie having been eaten before she can put the topping on. how much 1 square inch strips of dough will she need for the top, now that a portion is missing? round your answer to the nearest while nimber.
Answers: 1
Mathematics, 22.06.2019 00:30, brainist71
L|| m if m? 1=125 and m? 7=50 then m? 5= 5 55 75 105 next question ask for turn it in © 2014 glynlyon, inc. all rights reserved. terms of use
Answers: 3
You know the right answer?
The scatterplot to the left depicts the carbon dioxide (CO2)
concentration, in parts per million (p...
Questions in other subjects:

Mathematics, 05.05.2020 06:37
Mathematics, 05.05.2020 06:37

Physics, 05.05.2020 06:37

English, 05.05.2020 06:37

Biology, 05.05.2020 06:37


