
Mathematics, 03.11.2020 01:00 punani
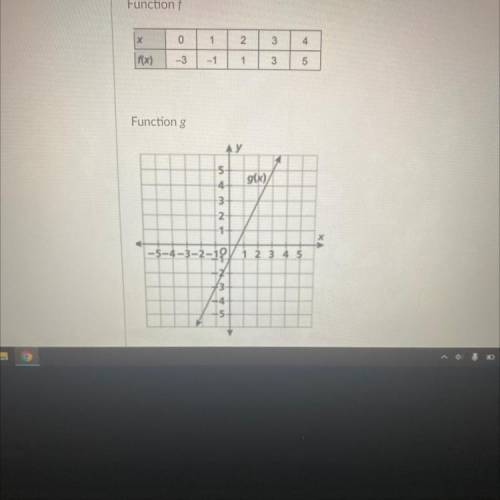
The table represents Function f and the graph represents Function g. Use the table
and graph to answer the questions.
a ) what is the y-intercept for function f? b) what is the y-intercept for function g? c) what is the rate of change (slope) for function f? d) what is the rate of change ( slope) for function g?

Answers: 2


Other questions on the subject: Mathematics
Mathematics, 21.06.2019 15:30, MidnightYT
Find the slope of the line below . enter your answer as a fraction or decimal. use a slash mark ( / ) as the fraction bar if necessary
Answers: 1
Mathematics, 22.06.2019 02:00, samarahbrown6050
Graph a triangle (xyz) and reflect it over the line y=x to create triangle x’y’z’. describe the transformation using words. draw a line segment from point x to the reflecting line, and then draw a line segment from point x’ to the reflecting line. what do you notice about the two line segments you drew? do you think you would see the same characteristics if you drew the line segment connecting y with the reflecting line and then y’ with the reflecting line? how do you know?
Answers: 1
You know the right answer?
The table represents Function f and the graph represents Function g. Use the table
and graph to ans...
Questions in other subjects:

Social Studies, 22.05.2020 00:15

Social Studies, 22.05.2020 00:15
English, 22.05.2020 00:15

English, 22.05.2020 00:15


