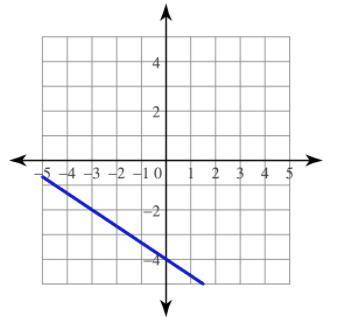
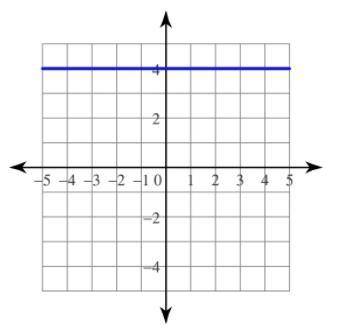
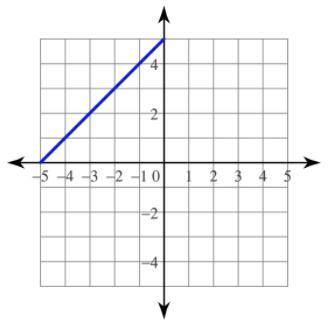
What are the equations to these graphs?
(30PTS)
...

Mathematics, 03.11.2020 01:00 chloiesierra29
What are the equations to these graphs?
(30PTS)

Answers: 2


Other questions on the subject: Mathematics
Mathematics, 21.06.2019 13:30, lizzlegnz999
12. decide whether each statement is always true, sometimes true, or never true. a. when corresponding points of an original figure and its reflection are connected, the resulting segments are all perpendicular to the line of reflection. b. when a point is reflected over a horizontal line, the y-coordinate of the point stays the same. answer both questions and explain
Answers: 2
Mathematics, 21.06.2019 19:00, megkate
1. writing an equation for an exponential function by 2. a piece of paper that is 0.6 millimeter thick is folded. write an equation for the thickness t of the paper in millimeters as a function of the number n of folds. the equation is t(n)= 3. enter an equation for the function that includes the points. (-2, 2/5) and (-1,2)
Answers: 1
Mathematics, 21.06.2019 19:30, shanua
Needmax recorded the heights of 500 male humans. he found that the heights were normally distributed around a mean of 177 centimeters. which statements about max’s data must be true? a) the median of max’s data is 250 b) more than half of the data points max recorded were 177 centimeters. c) a data point chosen at random is as likely to be above the mean as it is to be below the mean. d) every height within three standard deviations of the mean is equally likely to be chosen if a data point is selected at random.
Answers: 2
Mathematics, 21.06.2019 21:30, fheight01
Name and describe the three most important measures of central tendency. choose the correct answer below. a. the mean, sample size, and mode are the most important measures of central tendency. the mean of a data set is the sum of the observations divided by the middle value in its ordered list. the sample size of a data set is the number of observations. the mode of a data set is its highest value in its ordered list. b. the sample size, median, and mode are the most important measures of central tendency. the sample size of a data set is the difference between the highest value and lowest value in its ordered list. the median of a data set is its most frequently occurring value. the mode of a data set is sum of the observations divided by the number of observations. c. the mean, median, and mode are the most important measures of central tendency. the mean of a data set is the product of the observations divided by the number of observations. the median of a data set is the lowest value in its ordered list. the mode of a data set is its least frequently occurring value. d. the mean, median, and mode are the most important measures of central tendency. the mean of a data set is its arithmetic average. the median of a data set is the middle value in its ordered list. the mode of a data set is its most frequently occurring value.
Answers: 3
You know the right answer?
Questions in other subjects:

Mathematics, 25.01.2021 23:50

Mathematics, 25.01.2021 23:50

Social Studies, 25.01.2021 23:50


Chemistry, 25.01.2021 23:50


