Which graph represents the inequality?
y greater-than negative one-half
A
B
...

Mathematics, 02.11.2020 23:20 surpremeblizzle
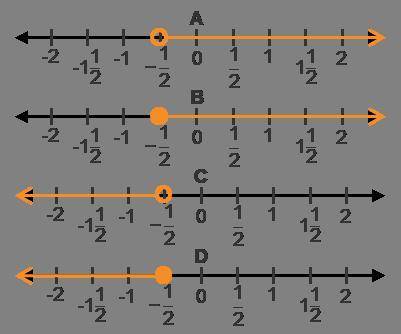
Which graph represents the inequality?
y greater-than negative one-half
A
B
C
D

Answers: 3


Other questions on the subject: Mathematics
Mathematics, 21.06.2019 12:50, angelamirga332
Which logarithmic equation is equivalent to the exponential equation below? e^a=55(you will receive 34 points)
Answers: 1
Mathematics, 21.06.2019 17:40, kayleeemerson77
The graph of h(x)= |x-10| +6 is shown. on which interval is this graph increasing
Answers: 2
Mathematics, 21.06.2019 18:00, bvaughn6477
Clara schumann is buying bagels for her coworkers, she buys a dozen bagels priced at $5.49 a dozen. the bakery's cost for making the bagels is $2.25 per dozen. what is the markup rate based on selling price on a dozen bagels?
Answers: 1
Mathematics, 21.06.2019 20:00, Chen5968
The distribution of the amount of money spent by students for textbooks in a semester is approximately normal in shape with a mean of $235 and a standard deviation of $20. according to the standard deviation rule, how much did almost all (99.7%) of the students spend on textbooks in a semester?
Answers: 2
You know the right answer?
Questions in other subjects:
Mathematics, 05.09.2020 19:01

English, 05.09.2020 19:01

English, 05.09.2020 19:01


Social Studies, 05.09.2020 19:01


