4. Use the graph to estimate
the average rate of
change in the interval.
(Just d...

Mathematics, 01.11.2020 23:50 IdkHowToDoMath
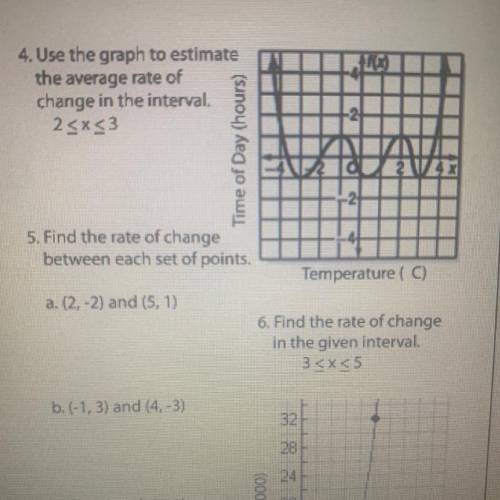
4. Use the graph to estimate
the average rate of
change in the interval.
(Just do number 4)

Answers: 2


Other questions on the subject: Mathematics
Mathematics, 21.06.2019 20:50, elha20
Samson is going shopping for sugar and butter to make three different kinds of cookies: lemon bars, peanut butter cookies, and sugar cookies. the recipe for lemon bars calls for 2 cups of flour, 2 cups of sugar, and 1 stick of butter. the peanut butter cookie recipe calls for 2 cups of flour, 4 cup of sugar and 2 stick of butter. the sugar cookie recipe calls for 1 cup of flour, 2 cups of sugar, and 2 sticks of butter. sampson has 13 cups of flour at home, and he buys 12 cups (6 pounds) of sugar and 10 sticks of butter. how many batches of each type of cookie can he make? samson can make batches of lemon bars, batches of peanut butter cookies, and batches of 09 cookies submit reset
Answers: 1
Mathematics, 21.06.2019 23:30, kathlynskare06
Side xy of triangle xyz is extended to point w, creating a linear pair with ∠wyz and ∠xyz. measure of an exterior angle what is the value of x? 64 80 100 180
Answers: 2
Mathematics, 21.06.2019 23:30, Masielovebug
Segment wx is shown explain how you would construct a perpendicular bisector of wx using a compass and a straightedge
Answers: 3
Mathematics, 21.06.2019 23:40, breannaasmith1122
Me d is also an option but i couldn't get it in the picture
Answers: 2
You know the right answer?
Questions in other subjects:

History, 08.06.2021 18:50

Mathematics, 08.06.2021 18:50
Mathematics, 08.06.2021 18:50
Mathematics, 08.06.2021 18:50


