
Mathematics, 31.10.2020 21:50 jack6563
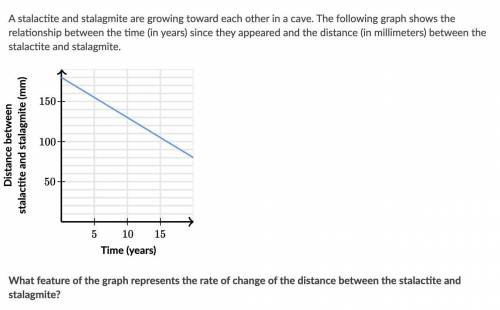
A stalactite and stalagmite are growing toward each other in a cave. The following graph shows the relationship between the time (in years) since they appeared and the distance (in millimeters) between the stalactite and stalagmite. What feature of the graph represents the rate of change of the distance between the stalactite and stalagmite? slope, x-intercept, y-intercept, or none of the above

Answers: 3


Other questions on the subject: Mathematics
Mathematics, 21.06.2019 18:30, rocksquad9125
Ricky takes out a $31,800 student loan to pay his expenses while he is in college. after graduation, he will begin making payments of $190.66 per month for the next 30 years to pay off the loan. how much more will ricky end up paying for the loan than the original value of $31,800? ricky will end up paying $ more than he borrowed to pay off the loan.
Answers: 1
Mathematics, 21.06.2019 19:00, GodlyGamer8239
Billy plotted −3 4 and −1 4 on a number line to determine that −3 4 is smaller than −1 4 .is he correct? explain why or why not
Answers: 3
Mathematics, 21.06.2019 20:00, ZaneKun
Need ! the total ticket sales for a high school basketball game were $2,260. the ticket price for students were $2.25 less than the adult ticket price. the number of adult tickets sold was 230, and the number of student tickets sold was 180. what was the price of an adult ticket?
Answers: 1
Mathematics, 21.06.2019 21:10, elnkun98owvaa6
The equation |pl = 2 represents the total number of points that can be earned or lost during one turn of a game. which best describes how many points can be earned or lost during one turn? o o -2 2 oor 2 -2 or 2 o
Answers: 1
You know the right answer?
A stalactite and stalagmite are growing toward each other in a cave. The following graph shows the r...
Questions in other subjects:

English, 03.11.2020 01:00

Social Studies, 03.11.2020 01:00


English, 03.11.2020 01:00


