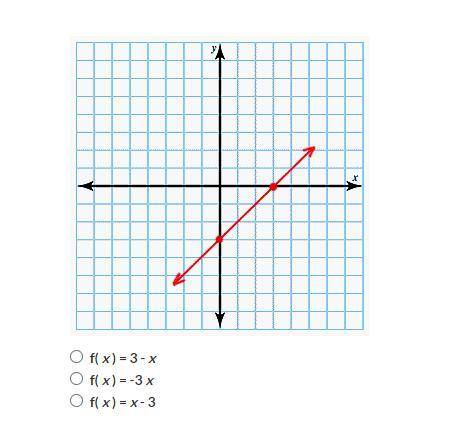
Which of the following function rules represents the graph shown?
...

Mathematics, 31.10.2020 15:10 teagan56
Which of the following function rules represents the graph shown?

Answers: 2


Other questions on the subject: Mathematics
Mathematics, 21.06.2019 13:30, iicekingmann
What value of x is in the solution set of –5x – 15 > 10 + 20x?
Answers: 1
Mathematics, 21.06.2019 22:00, d0ram0UsE
Rick is driving to his uncles house in greenville, which is 120 miles from ricks town .after covering x miles rick she's a sign stating that greensville is 20 miles away. which equation when solved will give the value of x. a: x+120 = 20 b: x x120 =20 c: x +20 equals 120 d: x x20= 120
Answers: 3
Mathematics, 21.06.2019 23:00, lilque6112
The table below shows the function f. determine the value of f(3) that will lead to an average rate of change of 19 over the interval [3, 5]. a. 32 b. -32 c. 25 d. -25
Answers: 2
Mathematics, 22.06.2019 02:00, s122784
Masons cell phone company charges $0.12 for every text message he sends plus $2.50 per month if mason sent 25 messages this month how much money does he owe the one with the correct answer and explanation gets 10 points and is marked as the brainliest answer
Answers: 1
You know the right answer?
Questions in other subjects:
Mathematics, 18.11.2020 18:30


Advanced Placement (AP), 18.11.2020 18:30
Social Studies, 18.11.2020 18:30

English, 18.11.2020 18:30
Mathematics, 18.11.2020 18:30


