
Mathematics, 31.10.2020 06:20 sonyfan
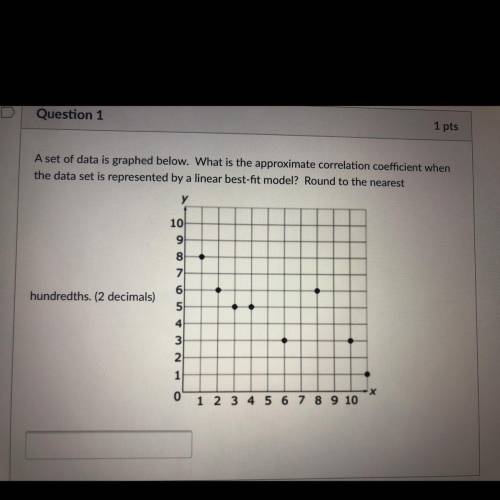
A set of data is graphed below. What is the approximate correlation coefficient when
the data set is represented by a linear best-fit model? Round to the nearest
у
10
9
8
7
6
hundredths. (2 decimals)
5
NWA
1
0
1 2 3 4 5 6
6 7 8 9 10

Answers: 3


Other questions on the subject: Mathematics
Mathematics, 22.06.2019 05:00, derrekdream123
Caleb and emily are standing 100 yards from each other. caleb looks up at a 45° angle to see a hot air balloon. emily looks up at a 60° angle to see the same hot air balloon. approximately how far is the hot air balloon off the ground? a)44.2 yd. b)63.4 yd. c)73.2 yd. d)89.7 yd.
Answers: 3
You know the right answer?
A set of data is graphed below. What is the approximate correlation coefficient when
the data set i...
Questions in other subjects:

Biology, 30.11.2020 22:50


