Mathematics, 30.10.2020 21:50 treymartinez7250
Analyzing Bivariate Data
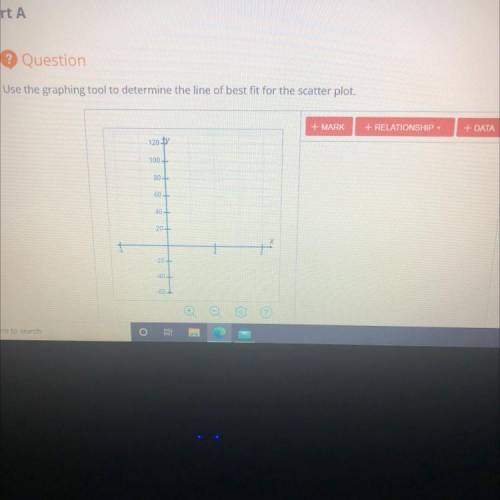
In this activity, you will draw a scatter plot and the line of best fit to analyze a situation.
Jeremy is on the planning committee for the rock climbing club. He is putting together a trip where members can go outdoor
rock climbing. He is trying to determine how high the group should climb and how long the trip should last. He calls multiple
parks in the area that offer rock climbing and collects data on the height of the rock formations and the average time it takes
people to reach the top and come back down. The data he found is shown.


Answers: 3


Other questions on the subject: Mathematics

Mathematics, 21.06.2019 18:30, sakria2002
What can each term of the equation be multiplied by to eliminate the fractions before solving? x – + 2x = + x 2 6 10 12
Answers: 1


Mathematics, 22.06.2019 03:30, nayi2002
Acollege is selling tickets for a winter fund-raiser. one day, krissa sold 14 adult tickets and 8 student tickets for a total of $376. the next day, she sold 7 adult tickets and 11 student tickets for a total of $272. krissa wanted to find the price of one adult ticket, a, and the price of one student ticket, s. she wrote and solved the following system of equations.
Answers: 1
You know the right answer?
Analyzing Bivariate Data
In this activity, you will draw a scatter plot and the line of best fit to...
Questions in other subjects:


Social Studies, 04.02.2020 00:07


Health, 04.02.2020 00:07

Health, 04.02.2020 00:07

Biology, 04.02.2020 00:07


Mathematics, 04.02.2020 00:07


