
Mathematics, 30.10.2020 19:50 juliannabartra
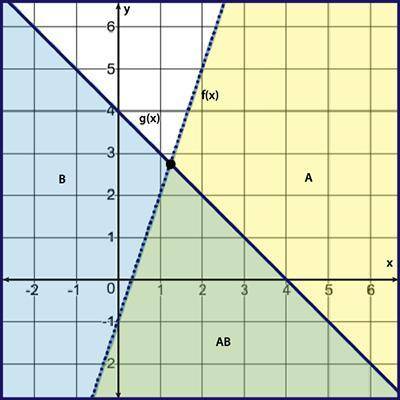
In the graph, the area below f(x) is shaded and labeled A, the area below g(x) is shaded and labeled B, and the area where f(x) and g(x) have shading in common is labeled AB. The graph represents which system of inequalities?
A. y ≤ −3x − 1
y ≤ −x − 4
B. y > −3x + 1
y ≤ −x − 4
C. y < 3x − 1
y ≤ −x + 4
D. y ≤ 3x − 1
y ≥ −x + 4

Answers: 3


Other questions on the subject: Mathematics
Mathematics, 21.06.2019 21:10, cheyennemitchel238
What is the equation of a line passing through (-6,5) and having a slope of 1/3
Answers: 3
Mathematics, 22.06.2019 02:30, nawafcanada
The graph shows the amount of total rainfall at each hour what was the total rainfall amount after three hours
Answers: 1
Mathematics, 22.06.2019 04:00, mariaramirez013
The function below is written in vertex form or intercept form. rewrite them in standard form and show your work. y = -3(x-2)(x-4)
Answers: 2
Mathematics, 22.06.2019 04:00, valensanta2005
Wholesome food company has been hired to design a healthy menu for the cafeteria at ridgemont high school. they want to conduct a survey to determine what percentage of ridgemont’s 15001500 students like broccoli. the survey will ask, “do you like broccoli? ”
Answers: 1
You know the right answer?
In the graph, the area below f(x) is shaded and labeled A, the area below g(x) is shaded and labeled...
Questions in other subjects:

Mathematics, 15.01.2021 22:40

Physics, 15.01.2021 22:40


English, 15.01.2021 22:40
Biology, 15.01.2021 22:40


