
Mathematics, 30.10.2020 04:00 jadejordan8888
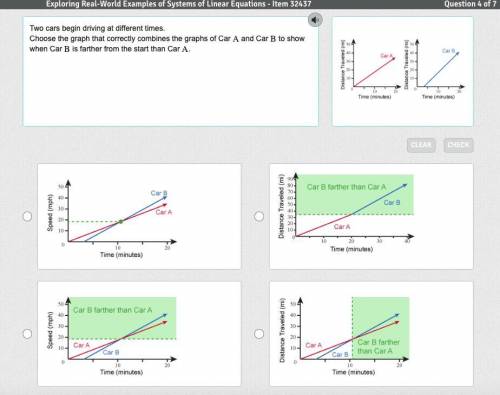
Two cars begin driving at different times. Choose the graph that correctly combines the graphs of Car A and Car B to show when Car B is farther from the start than Car A.

Answers: 2


Other questions on the subject: Mathematics
Mathematics, 21.06.2019 19:30, tgentryb60
Now max recorded the heights of 500 male humans. he found that the heights were normally distributed around a mean of 177 centimeters. which statements about max’s data must be true? a) the median of max’s data is 250 b) more than half of the data points max recorded were 177 centimeters. c) a data point chosen at random is as likely to be above the mean as it is to be below the mean. d) every height within three standard deviations of the mean is equally likely to be chosen if a data point is selected at random.
Answers: 1
Mathematics, 21.06.2019 20:00, offensiveneedle
1: 4 if the wew 35 surfboards at the beach how many were short boards?
Answers: 1
Mathematics, 21.06.2019 22:00, jamarstand
What is the equation of the line that is parallel to the line with the equation y= -3/4x +1 and passes through the point (12,-12)
Answers: 1
You know the right answer?
Two cars begin driving at different times.
Choose the graph that correctly combines the graphs of C...
Questions in other subjects:
Mathematics, 30.10.2020 14:00

History, 30.10.2020 14:00
Mathematics, 30.10.2020 14:00


Biology, 30.10.2020 14:00
Biology, 30.10.2020 14:00


