
Mathematics, 30.10.2020 03:50 flowersthomas1969
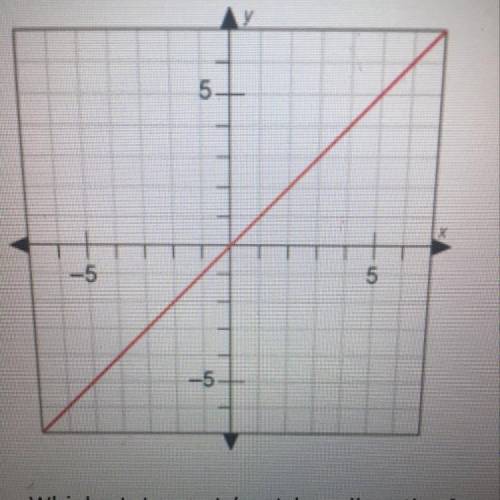
The graph shows the linear parent function . Which statement best describes the function?
A. The function is negative when x<0 and also when x>0
B. the function is never negative
C. the function is negative when x>0
D. The function is negative when x<0

Answers: 1


Other questions on the subject: Mathematics
Mathematics, 21.06.2019 17:00, yoongnzl
Solve with work both bert and ernie received an increase in their weekly salaries. bert's salary increased from $520 to $520. ernie's salary went from $580 to $645. find the percent of increase for each salary. what was the larger of the two percents ?
Answers: 1
Mathematics, 21.06.2019 19:50, leximae2186
The graph shows the distance kerri drives on a trip. what is kerri's speed?
Answers: 3
You know the right answer?
The graph shows the linear parent function . Which statement best describes the function?
A. The fu...
Questions in other subjects:

Physics, 18.11.2020 16:50

Mathematics, 18.11.2020 16:50

History, 18.11.2020 16:50


