
Mathematics, 29.10.2020 19:20 saraagracee
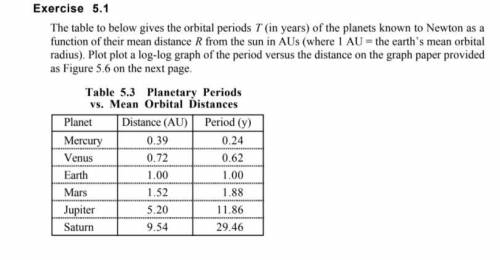
The table to below gives the orbital periods T (in years) of the planets known to Newton as a function of their mean distance R from the sun in AUs (where 1 AU = the earth’s mean orbital radius). Plot plot a log-log graph of the period versus the distance on the graph paper provided as Figure 5.6 on the next page.

Answers: 2


Other questions on the subject: Mathematics
Mathematics, 21.06.2019 18:00, Mrlittlefish
What is the location of point g, which partitions the directed line segment from d to f into a 5: 4 ratio? –1 0 2 3
Answers: 1
Mathematics, 21.06.2019 18:30, joaquin42
Which of the statements about the graph of the function y = 2x are true? check all of the boxes that apply. the domain is all real numbers x because the exponent of 2 can be any real number when the x-values increases by 1 unit, the y-value multiplies by 2. the y-intercept is (0, 1). the graph never goes below the x-axis because powers of 2 are never negative. the range is all real numbers.
Answers: 1
Mathematics, 21.06.2019 19:30, alanaruth3389
Consider a cube that has sides of length l. now consider putting the largest sphere you can inside this cube without any point on the sphere lying outside of the cube. the volume ratio -volume of the sphere/ volume of the cube is 1. 5.2 × 10⁻¹ 2. 3.8 × 10⁻¹ 3. 1.9 4. 2.5 × 10⁻¹ 5. 3.8
Answers: 2
Mathematics, 21.06.2019 22:00, LuckyCharms988
What is the solution to the equation e3x=12? round your answer to the nearest hundredth
Answers: 1
You know the right answer?
The table to below gives the orbital periods T (in years) of the planets known to Newton as a functi...
Questions in other subjects:


Social Studies, 13.07.2019 14:50


History, 13.07.2019 14:50

Mathematics, 13.07.2019 14:50


