
Mathematics, 29.10.2020 18:00 stephanielynch
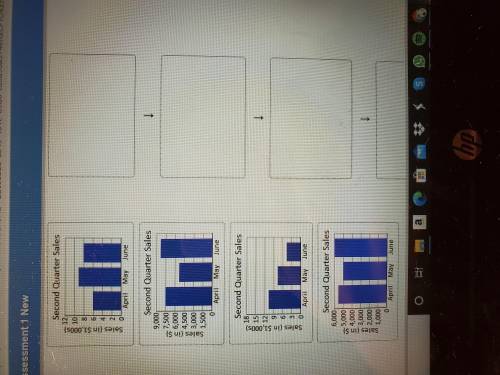
Four different garden supply stores recorded their second quarter sales in the bar graphs shown. Put the graphs in order from greatest to least according to their total amount sales for the second quarter. (Note: if a bar's height is between two consecutive axis values, then assume it is exactly halfway between them.)

Answers: 1


Other questions on the subject: Mathematics
Mathematics, 21.06.2019 21:00, mathishard353
Finding tbe values of the variables in each kite
Answers: 1
Mathematics, 22.06.2019 05:40, janeou17xn
Which line on the graph could represent this scenario?
Answers: 2
You know the right answer?
Four different garden supply stores recorded their second quarter sales in the bar graphs shown. Put...
Questions in other subjects:


English, 17.07.2020 08:01

Mathematics, 17.07.2020 08:01

Mathematics, 17.07.2020 08:01

Law, 17.07.2020 08:01
Mathematics, 17.07.2020 08:01


